

Want to see how Codenica could work for your company?
Create a free company account and test selected features in practice.
Codenica software brings together computer monitoring, asset inventory, ticketing and a user portal in one application. The screens below show concrete system views - from activity data and asset details, through tickets and the knowledge base, to the user's work in the portal. The Cloud version runs online in Microsoft Azure, while On-Premise is installed in your company's infrastructure, where your data is stored. Click an image to view its details.
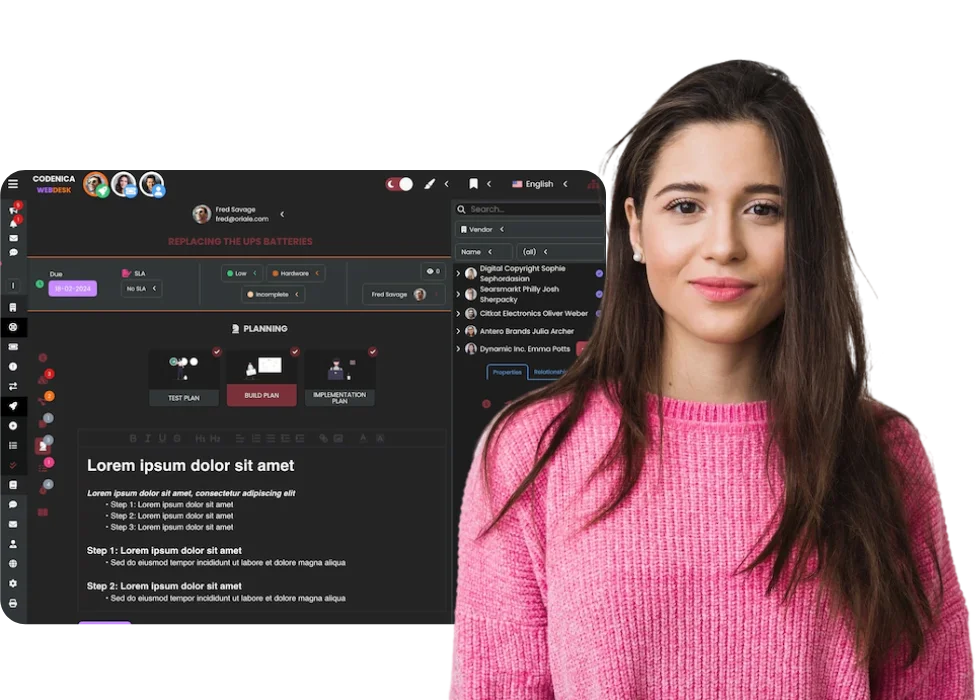

This short animation shows how Codenica is used on a computer. Thanks to PWA technology, you can run the system in a browser or use it like an application on a computer, tablet or phone. You can work in the Cloud or install the system locally in your company with the On-Premise edition.
Codenica's monitoring agent collects data about work time, applications, websites, documents and transfers, then presents it in separate views. This lets you move from an overall summary to a specific activity. You decide what to monitor, while the On-Premise edition keeps the collected data on a server inside your company and supports 100% offline work.
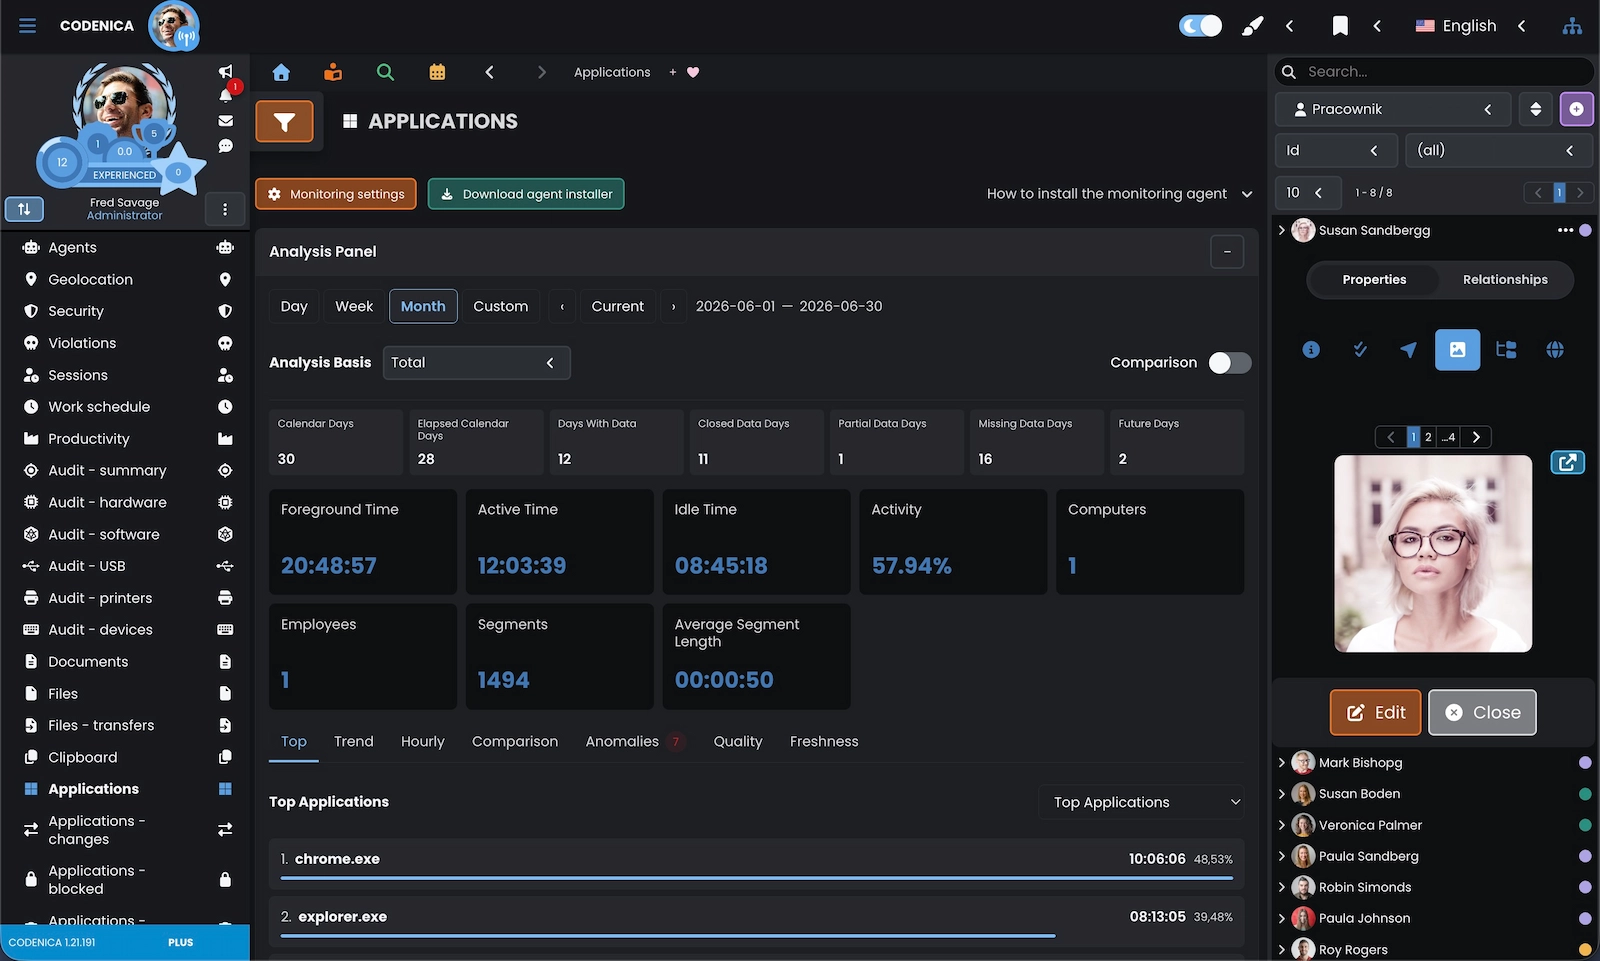
The monthly summary brings together active time, idle time, activity levels and the days for which data was collected. It also shows the number of monitored computers and the applications used during the selected period.
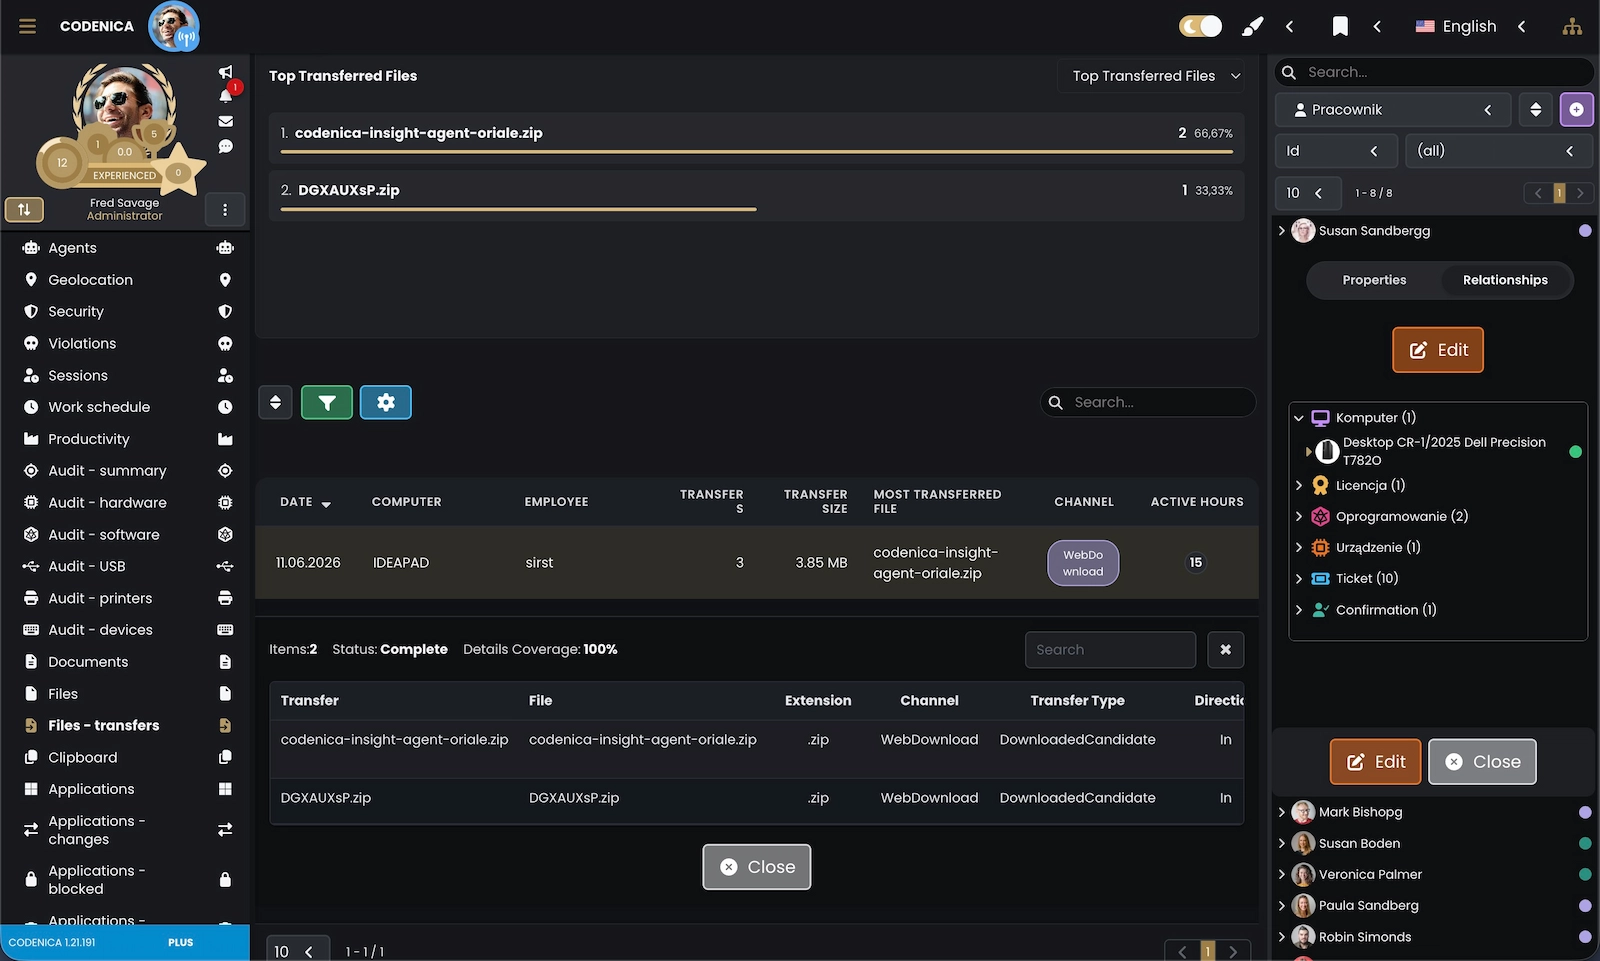
This view combines information about files, transfer counts and sizes, the computer, the user and the channel used for the transfer. Details of an individual event make it easier to establish what was transferred and when.
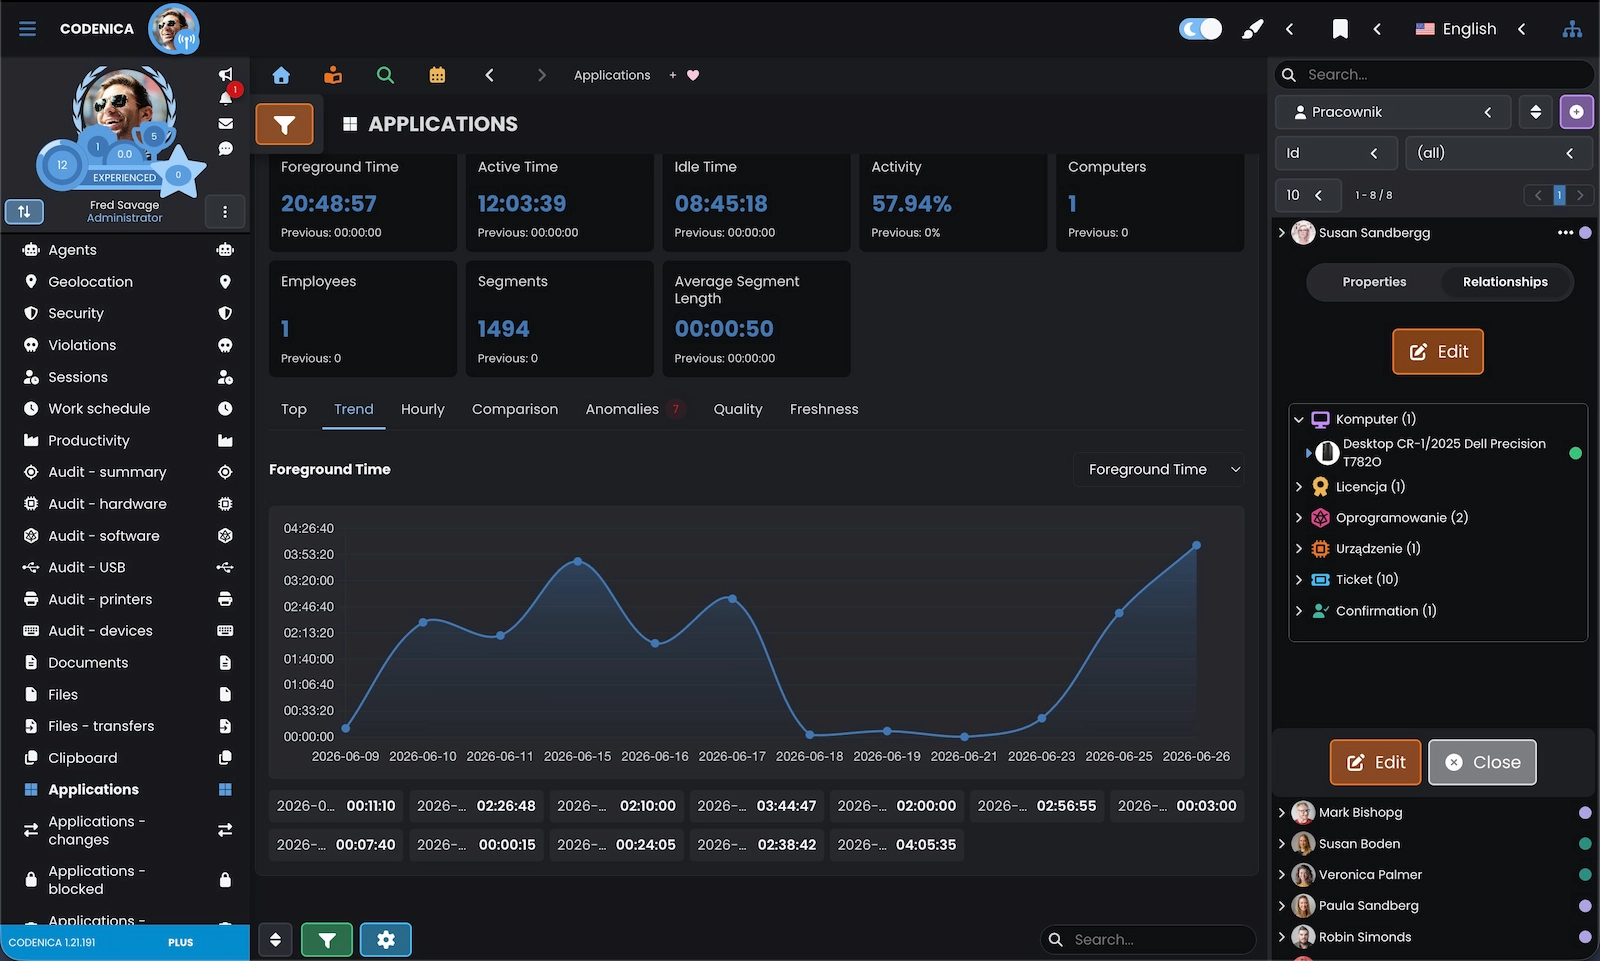
The chart shows how application usage time changed from day to day. You can spot periods of higher and lower activity and compare them with data from a particular computer or user.
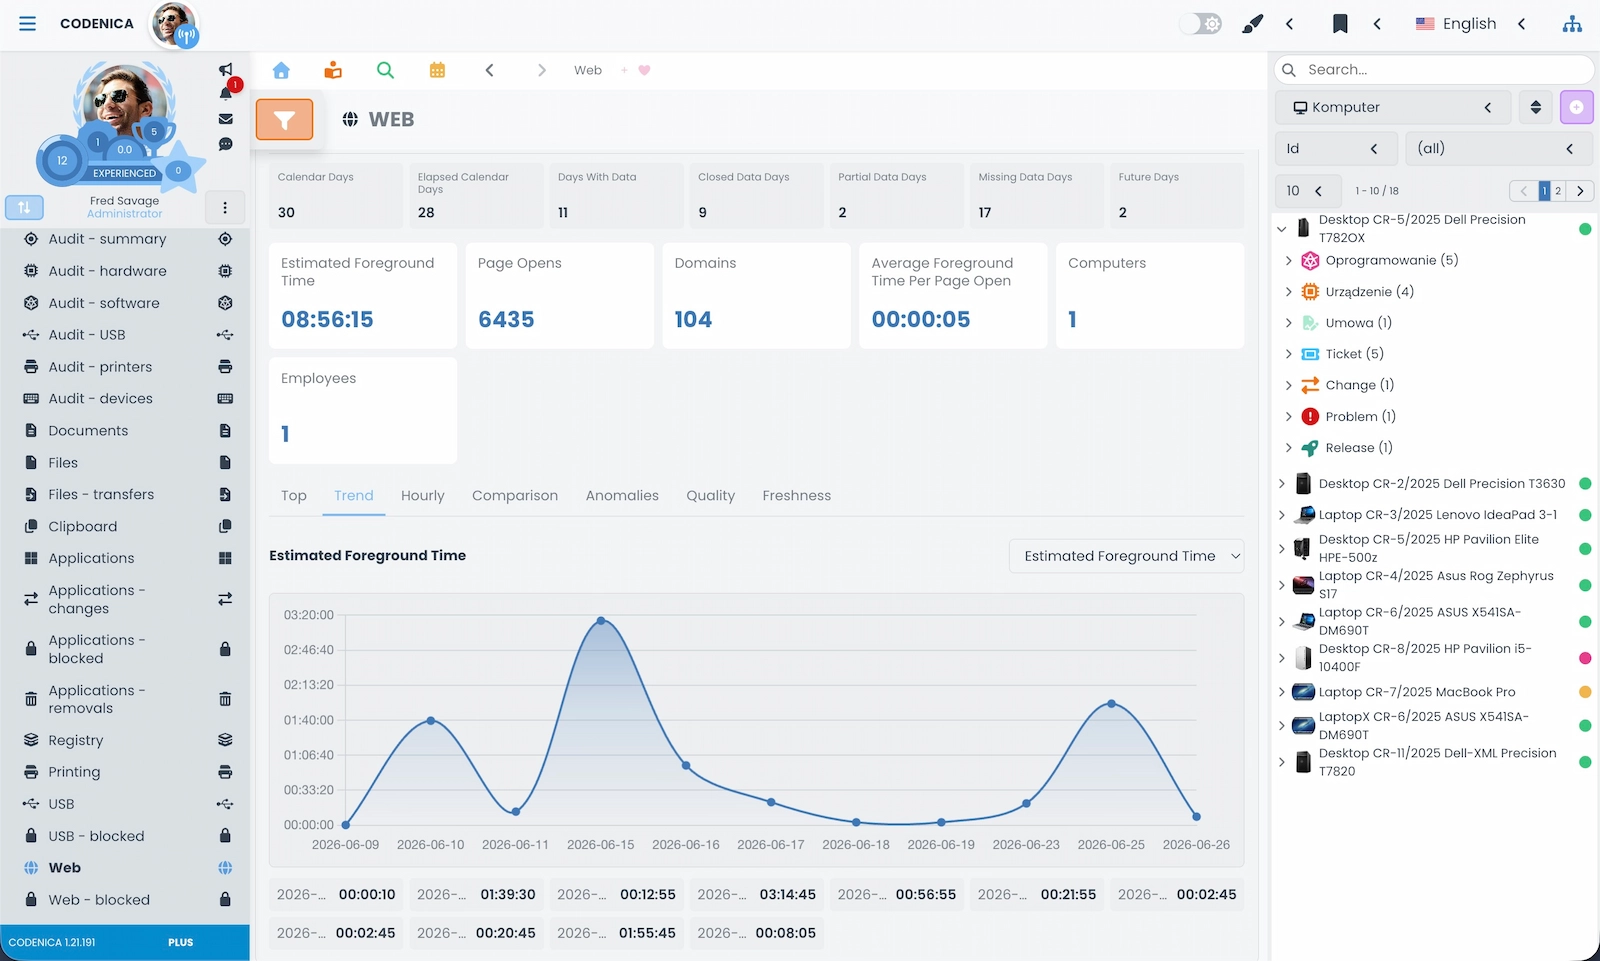
The internet activity summary shows estimated time spent on websites, page opens, domains and the average time per open. The chart makes it easier to compare activity across individual days.
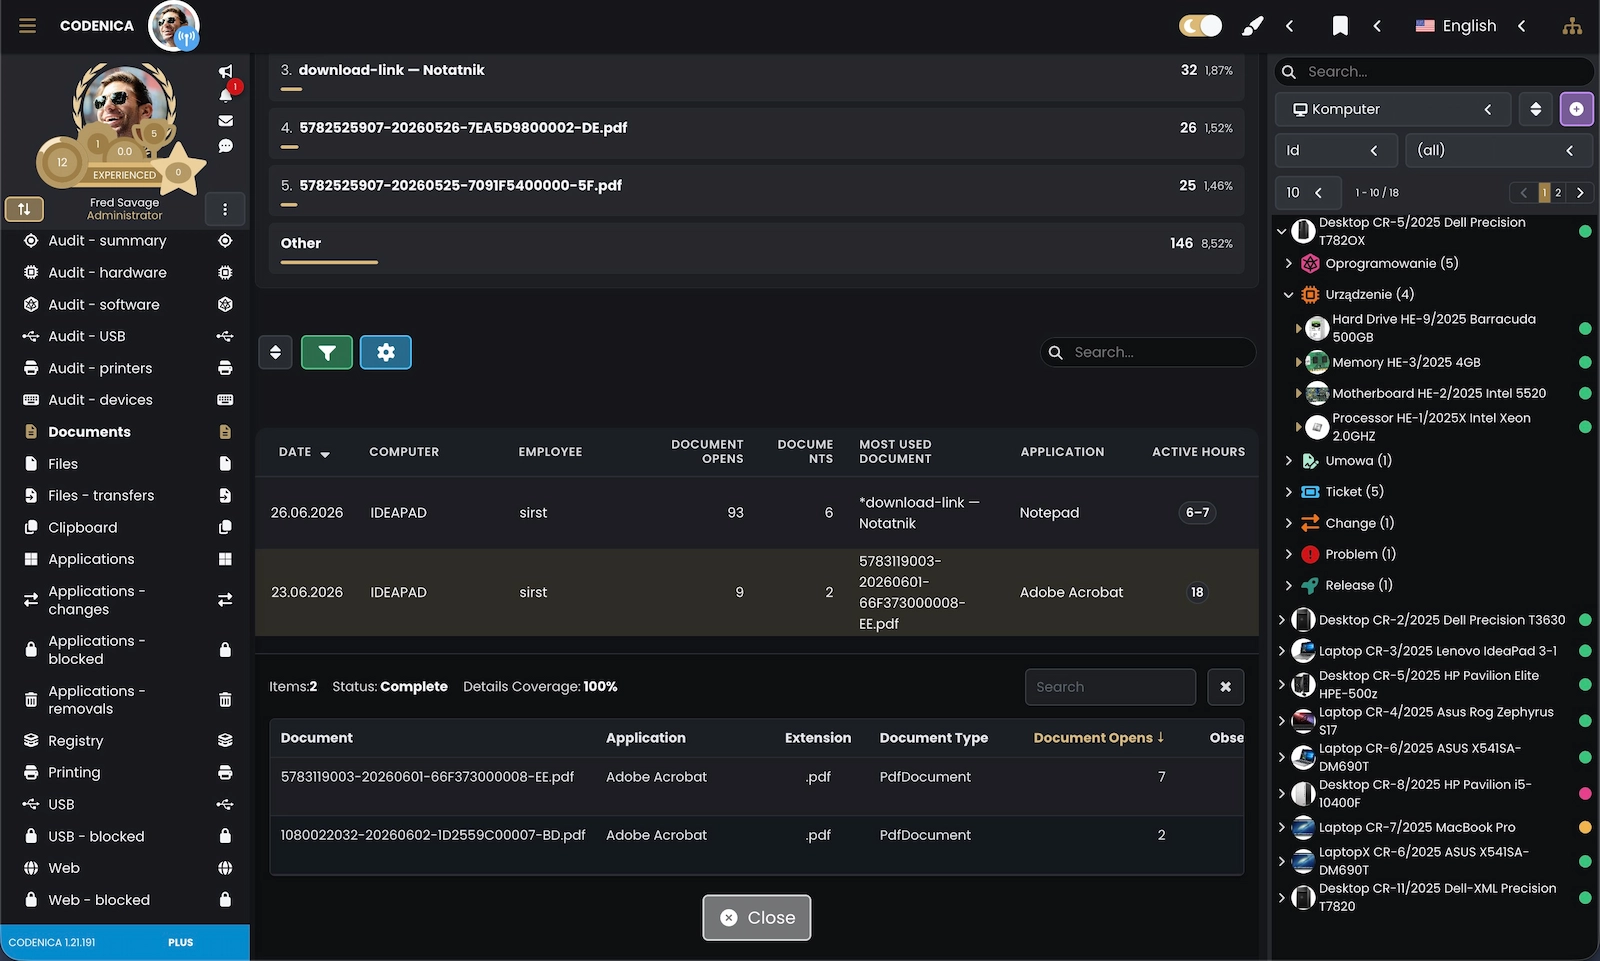
Document data shows how many files were opened, how often they were used and which applications opened them. The summary can be read together with the date, computer, user and activity time.
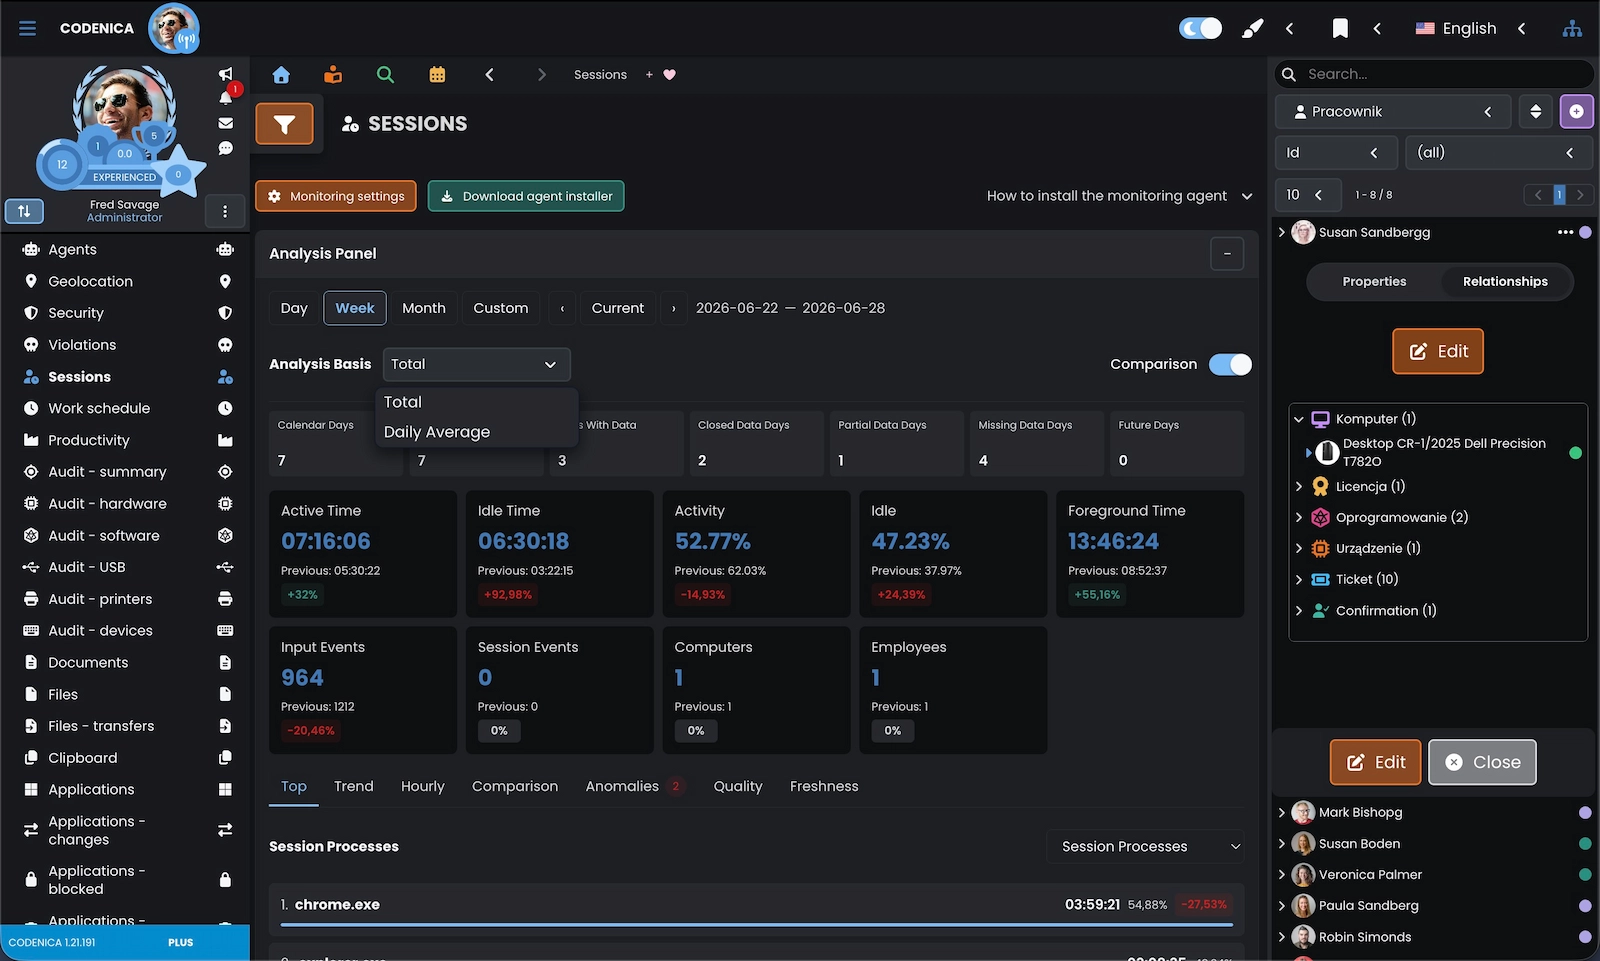
The weekly analysis compares active time, idle time, activity and application usage time. It is complemented by input events, computers, users and processes recorded during sessions.
This section shows day-to-day work with asset inventory: computers can be viewed as cards, a table or a compact view, while you can also open an employee profile, check a device and move on to its components. Each entry keeps the information that matters in practice - inventory number, manufacturer, model, status, person, location and related items. The inventory can be completed manually or with data from automated inventory scanning. If the system should run inside your company, on your own server and database, choose the On-Premise edition for your asset inventory.
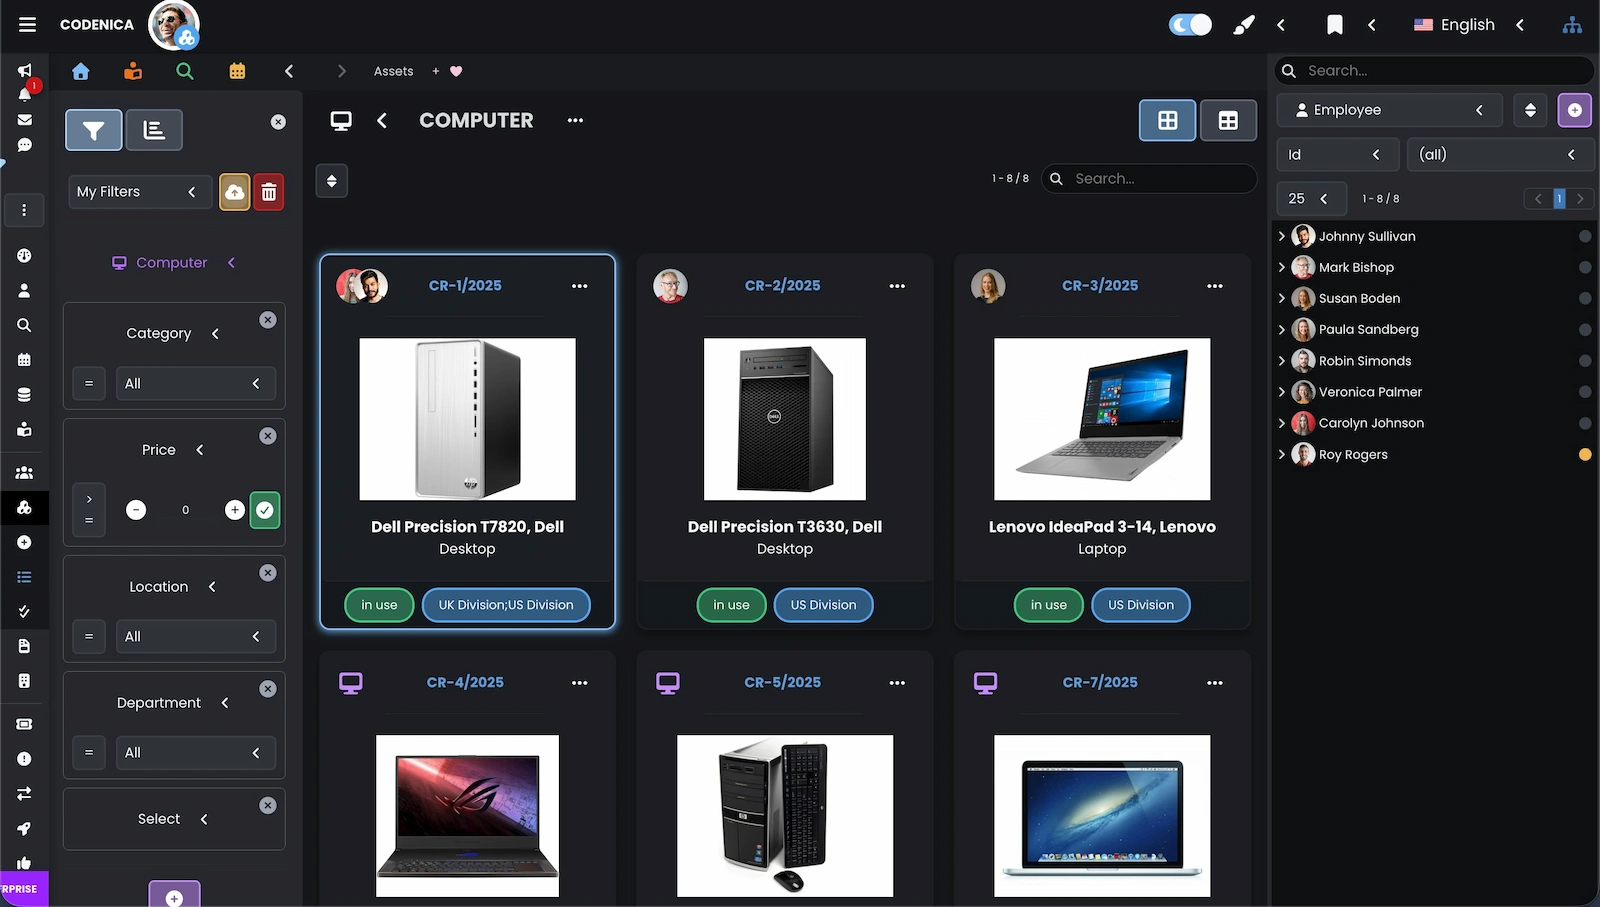
Computer cards show the key information about each device, including an image or icon, inventory number, name, category and status. Filters help narrow the asset inventory by location, department or other resource attributes.

The table makes it possible to compare a larger number of computers using inventory data and basic hardware information. Selecting a device takes you to its details.

An employee profile connects the person's details with their position, location and department. It also brings together the computers, software and hardware components assigned to that person.

A device card contains its name, type, category, status and inventory number, making the computer easy to find in the asset inventory. Its relationships show the person using it and the related handover confirmation.

After a computer is selected, the table remains visible above the details panel. You can review the device's basic information and relationships without leaving the asset inventory.
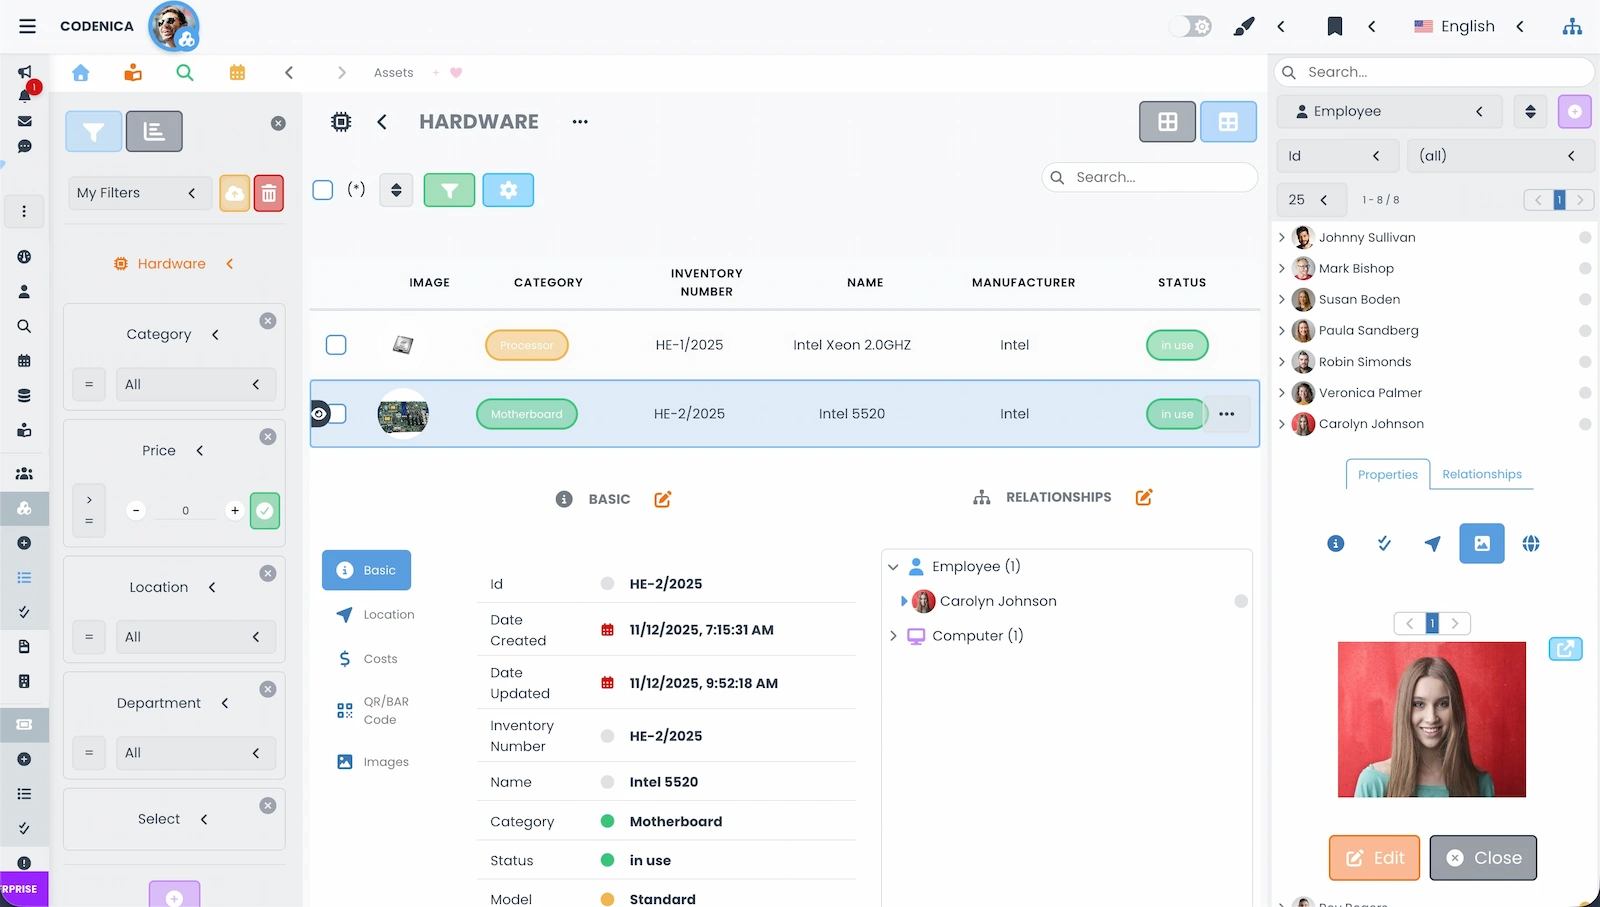
Component inventory lets you move from a computer to elements such as its processor or motherboard. Each component has its own data, status, inventory number and relationships with other assets.
When a ticket reaches the team, handling it does not end with assigning a number. The screens below show a ticket queue, a table that supports operations on multiple tickets, knowledge base articles, asset handover confirmations, a related asset, documents attached to a problem and change planning. Together, they show how the description, responsibility, due date, documents and next steps stay with the right ticket.
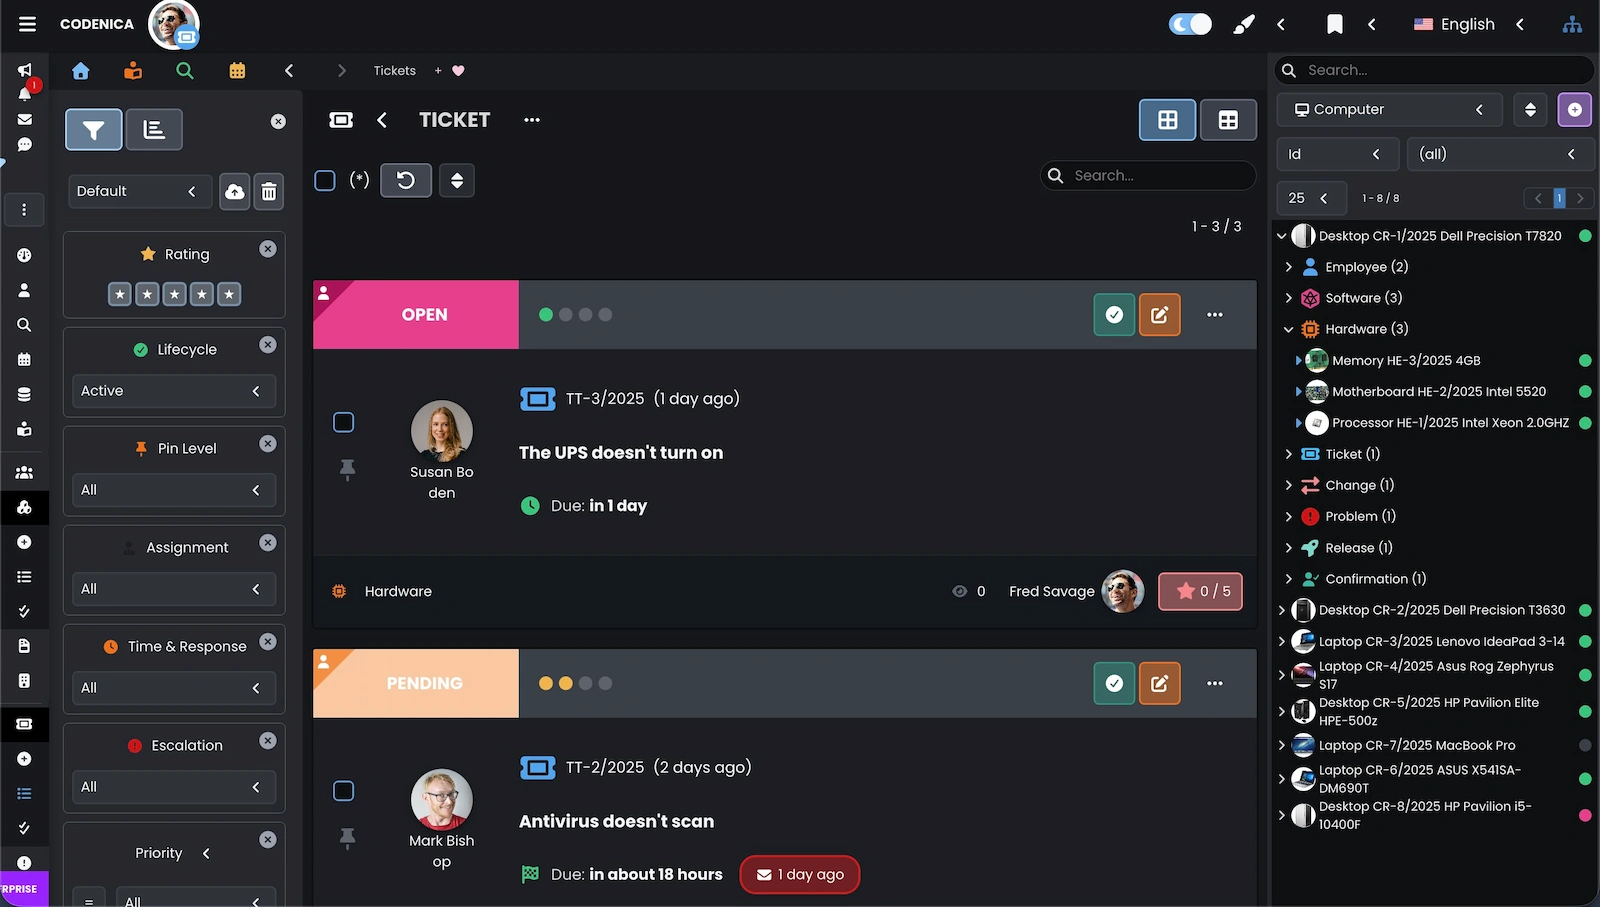
The card view makes it easy to recognize ticket statuses, due dates, requesters and the agents responsible for handling them. The filter panel helps narrow the queue to selected attributes.
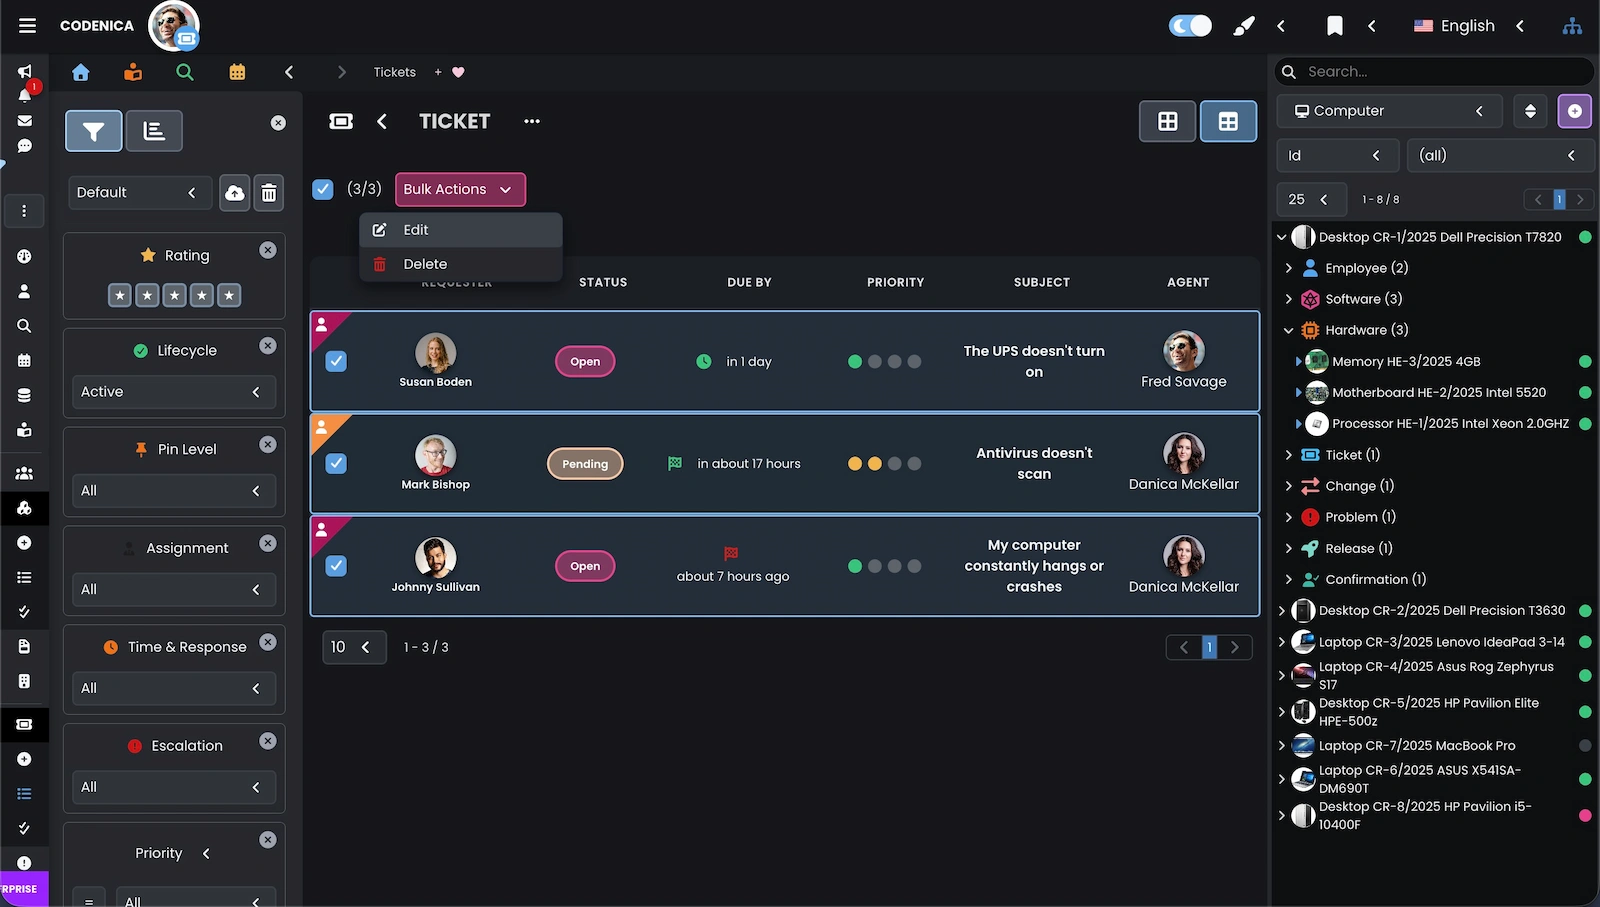
The table brings together requesters, statuses, due dates, priorities, subjects and assignees. Selecting several entries makes it possible to perform one operation on multiple tickets.
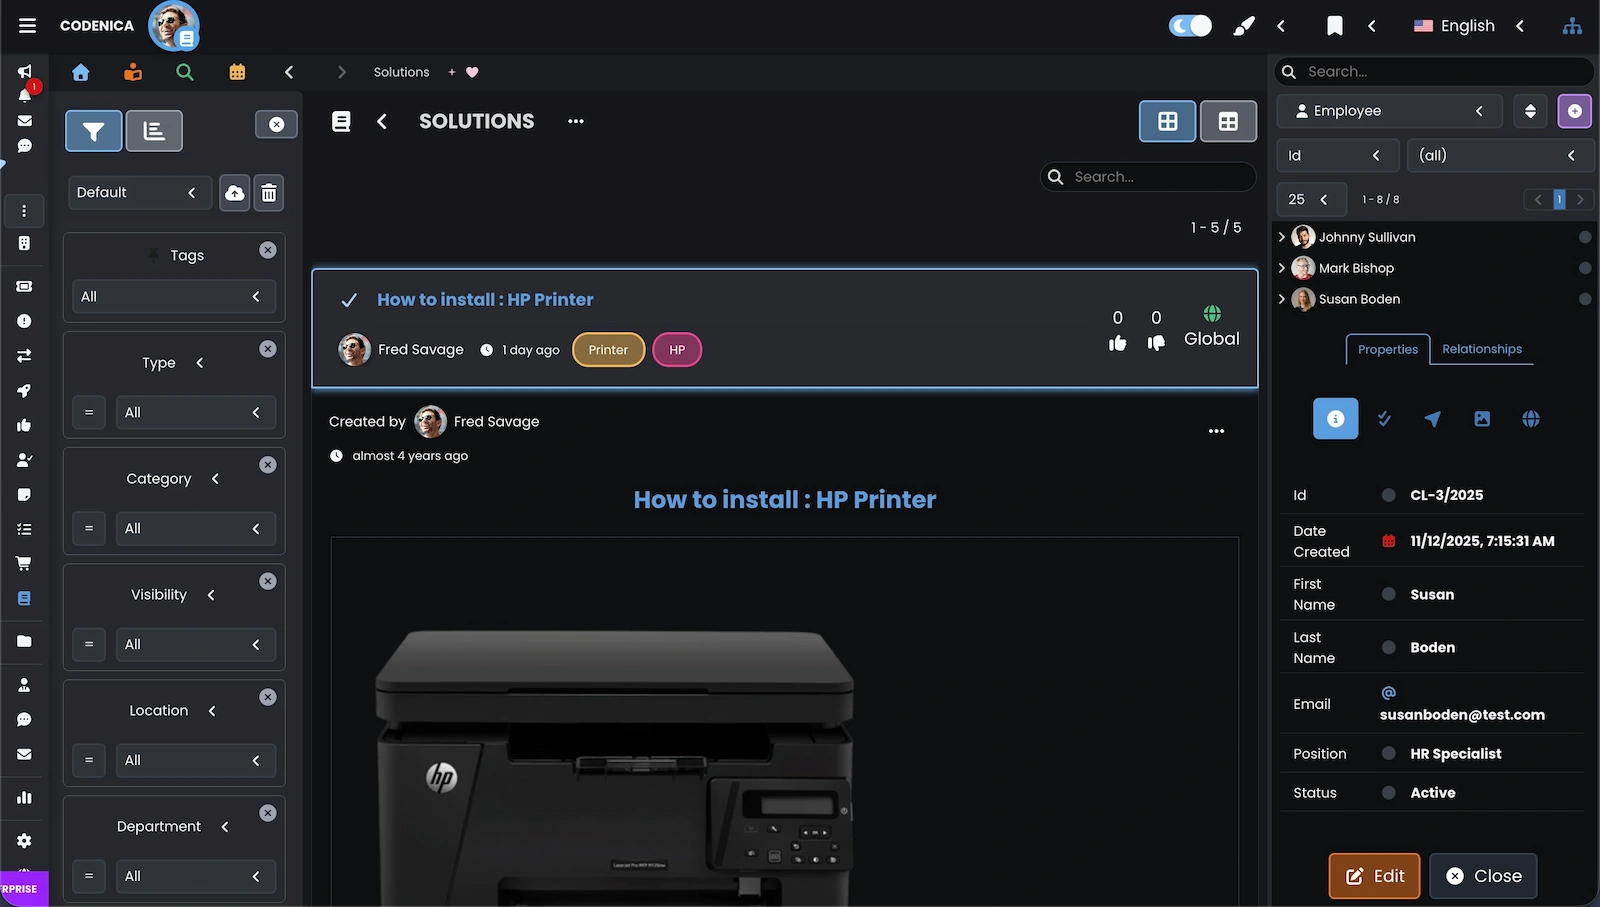
Article details show the author, date, categories, tags, visibility and the guide itself with an illustration. The material can lead a user through the solution to a specific problem.
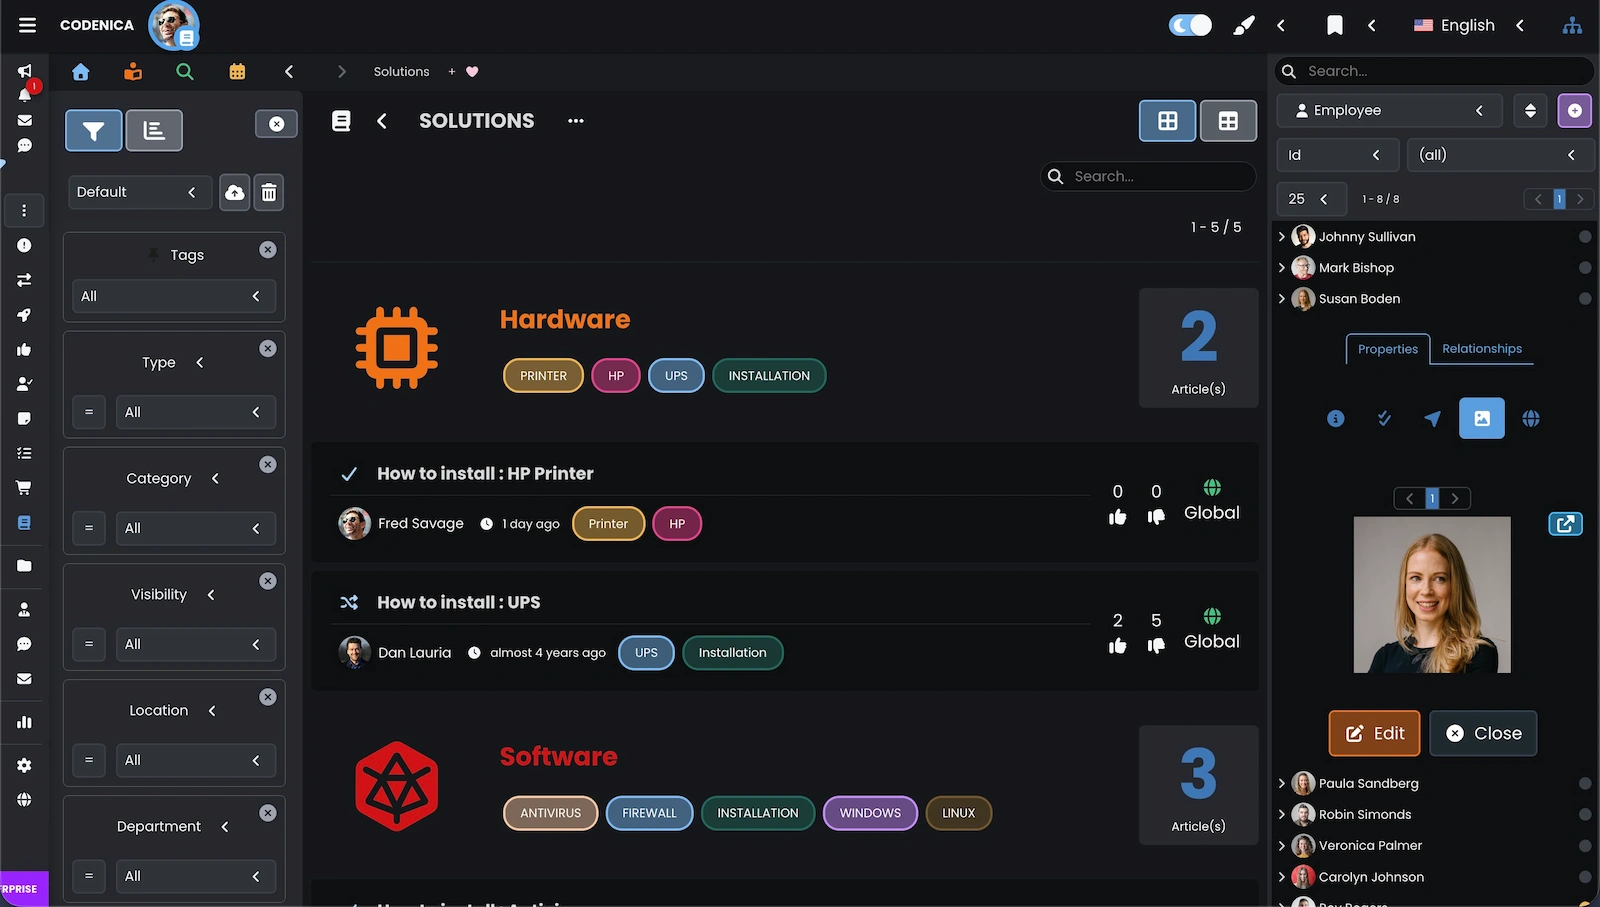
The knowledge base groups articles by category and shows how many materials each category contains. Tags help users recognize the subject of an instruction before opening it.
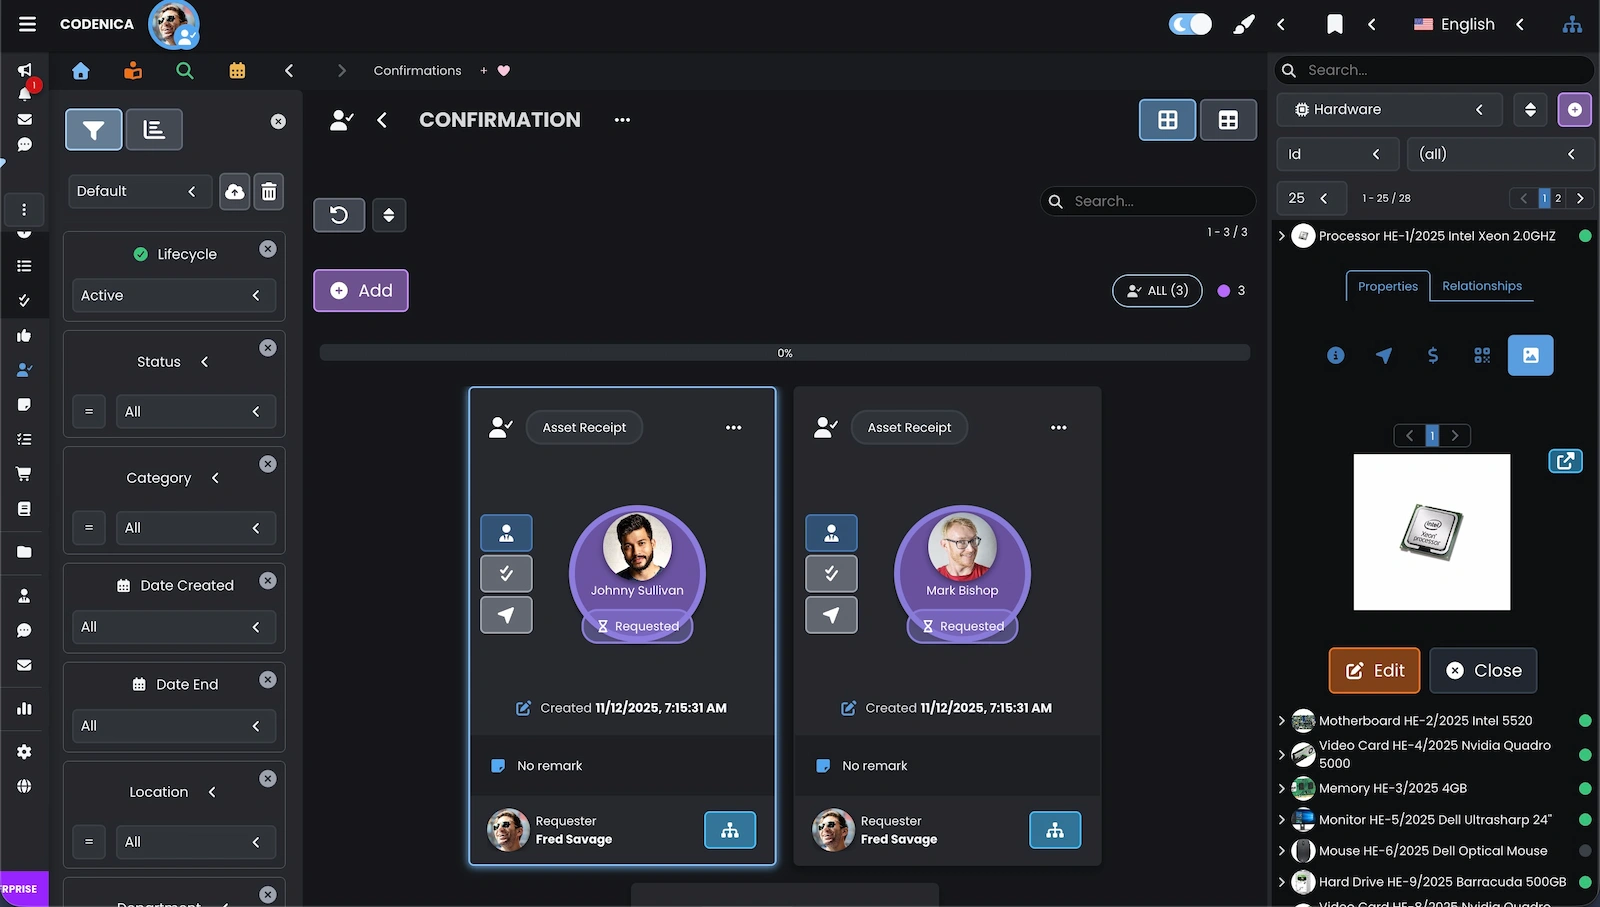
The confirmation panel shows documents related to handing equipment over to specific people. Each confirmation can include its status, creation date, author and additional notes.
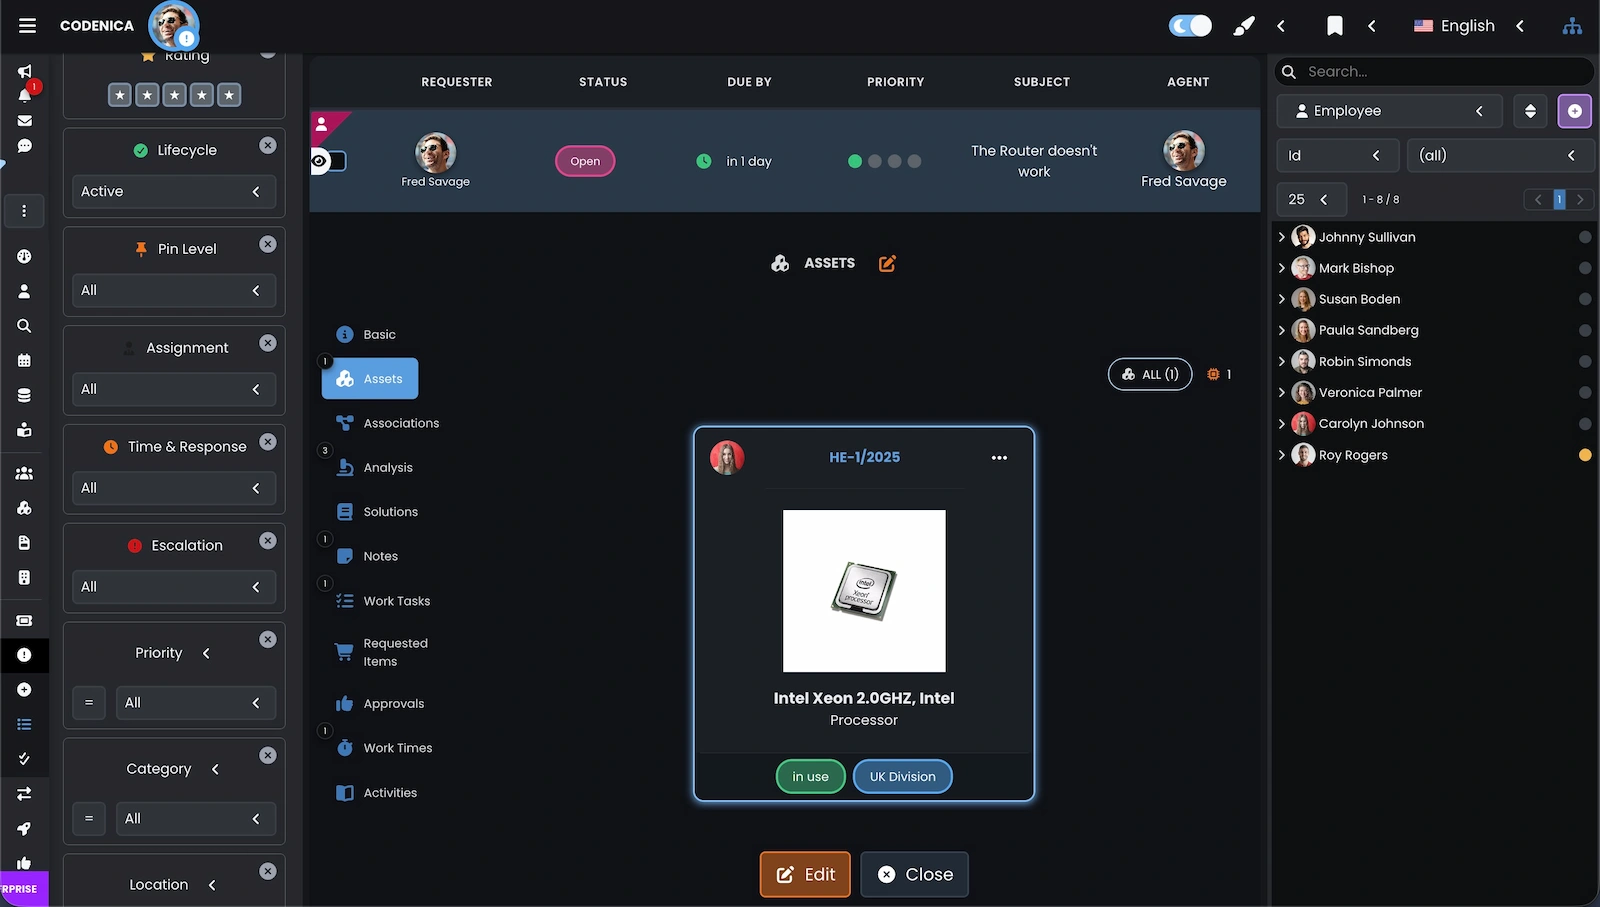
The visible ticket has its related assets section open. The related item has a clear description, type, status, location and inventory number, making it easy to find in the asset inventory.
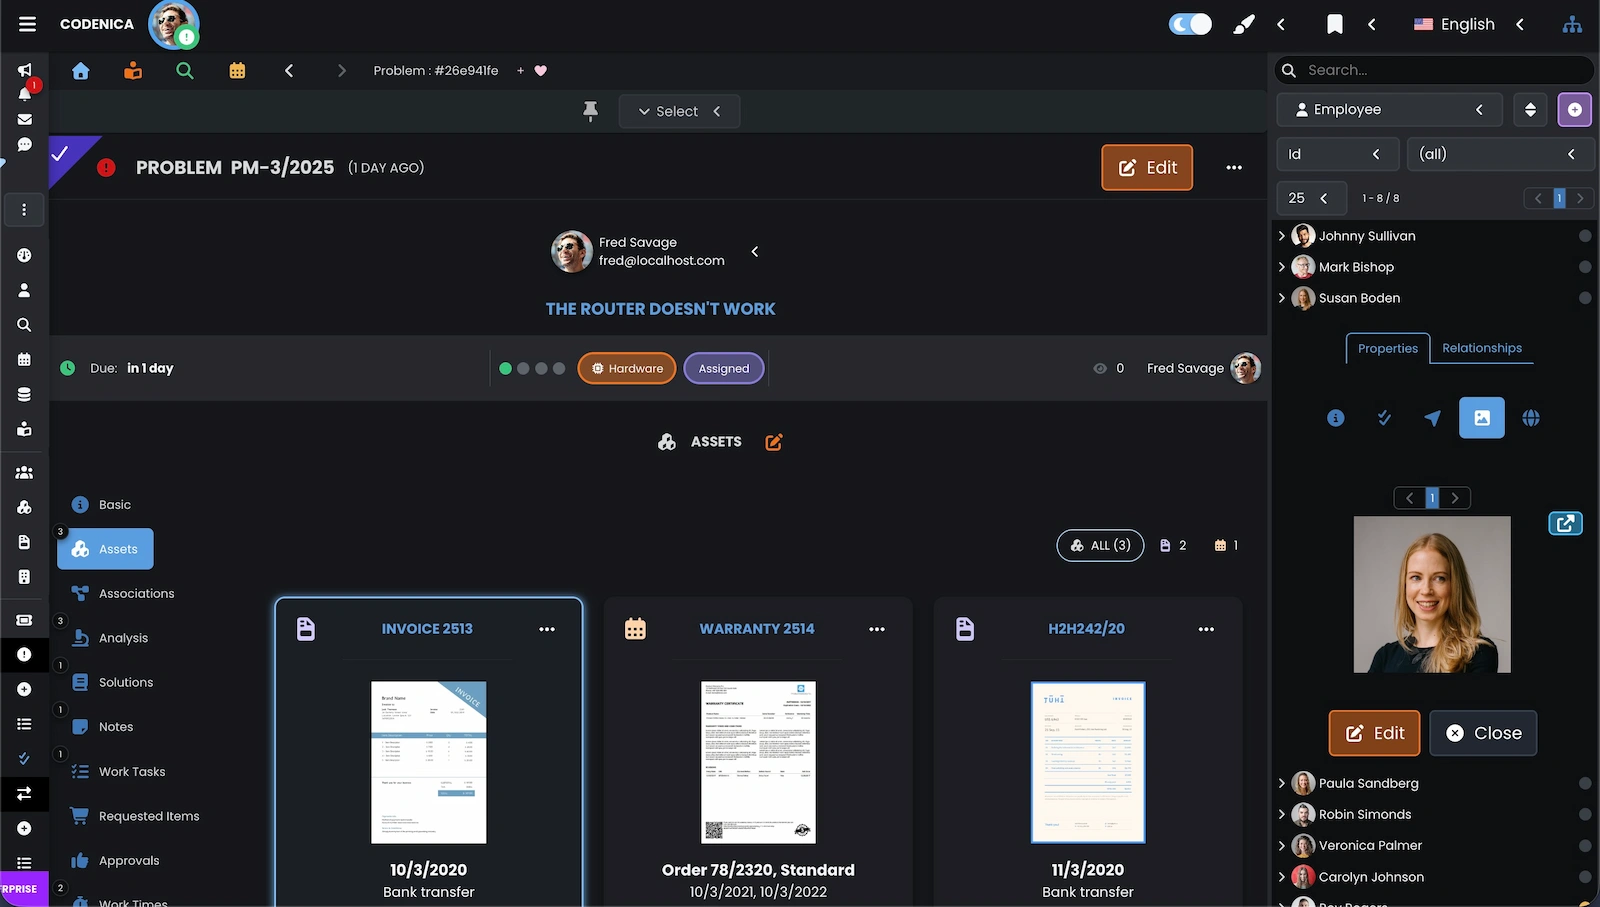
The visible problem ticket includes a section for related documents, such as an invoice, warranty and other materials. The documentation needed for analysis stays with the right ticket instead of being kept somewhere else.
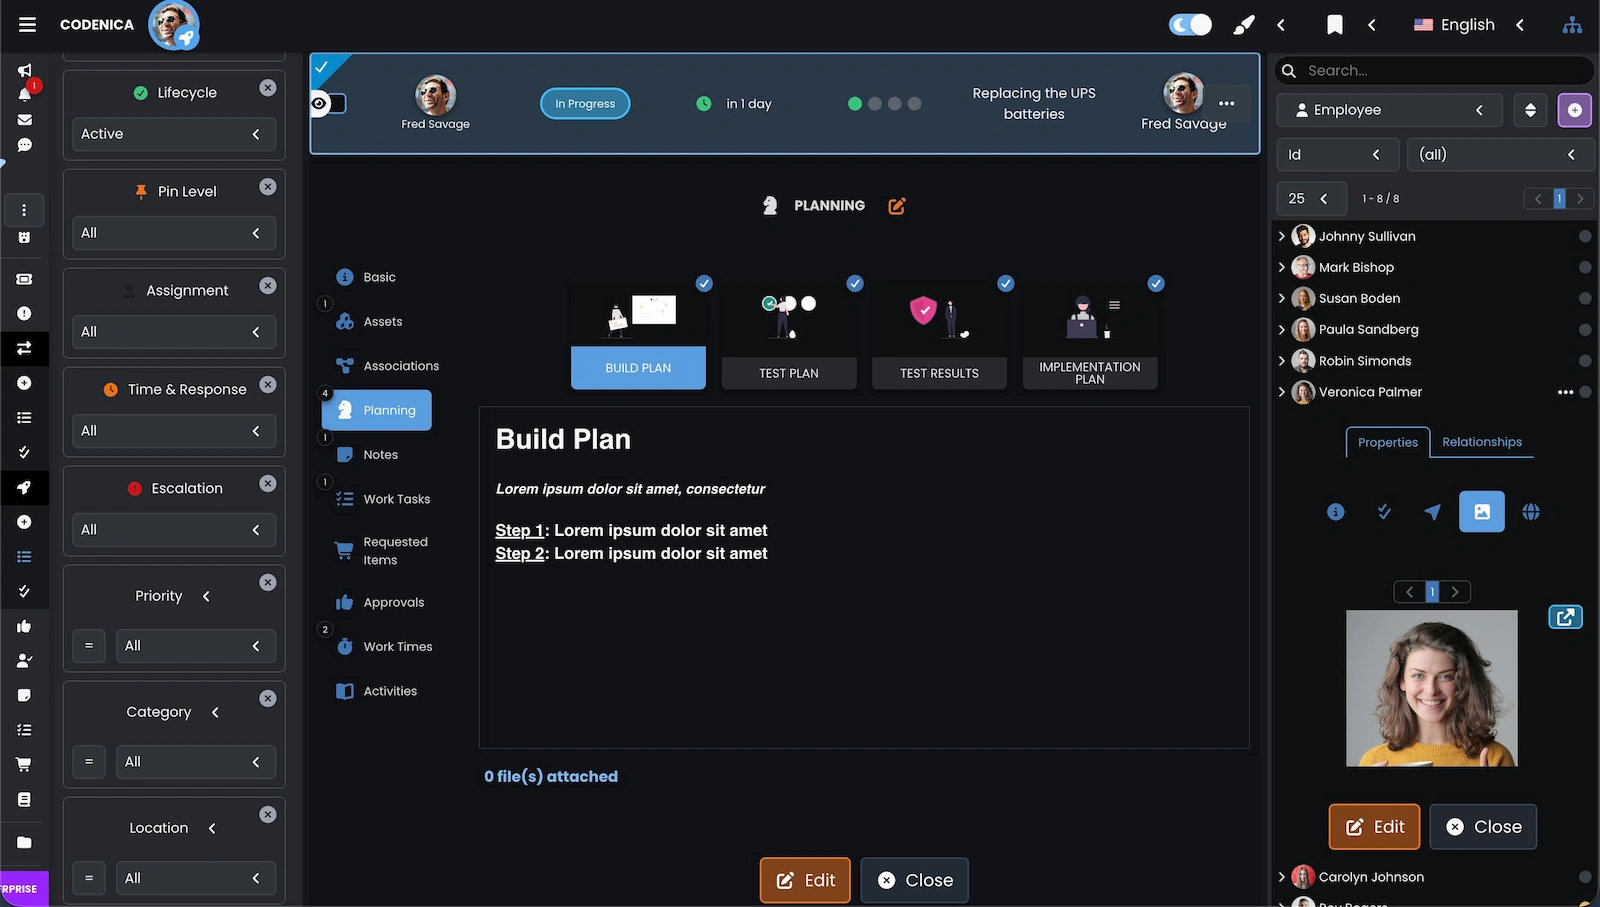
A change plan divides larger work into preparation, testing, reviewing results and deployment. Each stage can contain plan content, tasks and the attachments needed for the work.
The customer portal shown here gives customers or employees convenient access to selected information and contact with the company. Users can see their own data, instructions, tickets, assigned equipment, a form for a new ticket, chat and messages. You control what each person can see - a customer or employee does not receive access to the whole application back office. The customer portal works in both the Cloud version and a local On-Premise installation.
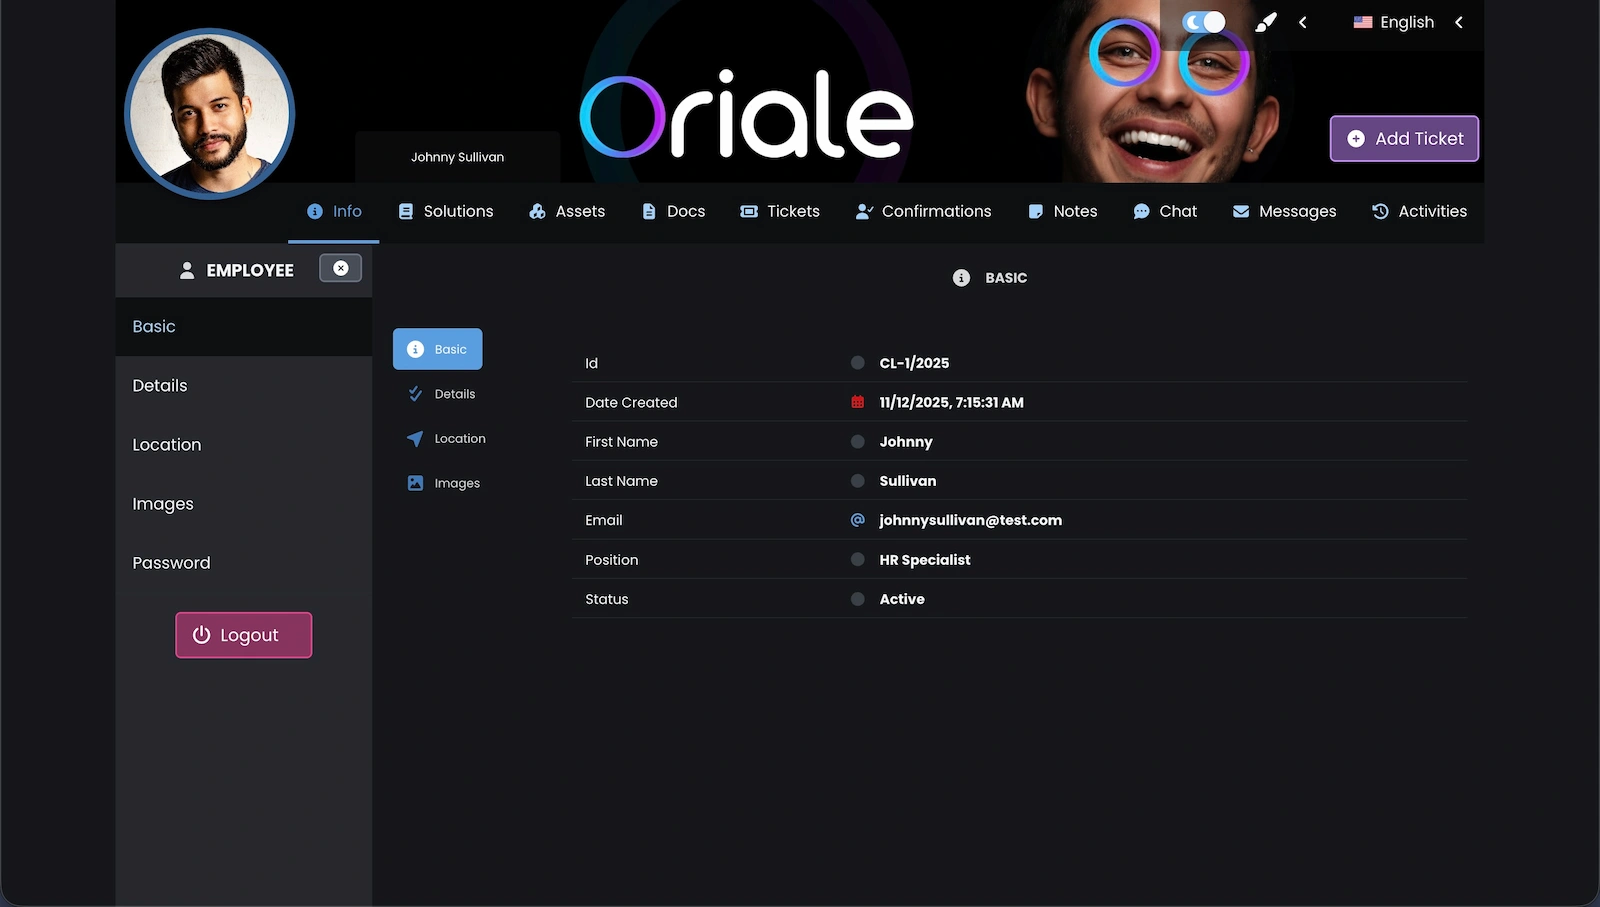
The user profile contains basic information, position and status, along with a menu for account details. The upper navigation provides access to tickets, the knowledge base, assets, documents and communication.
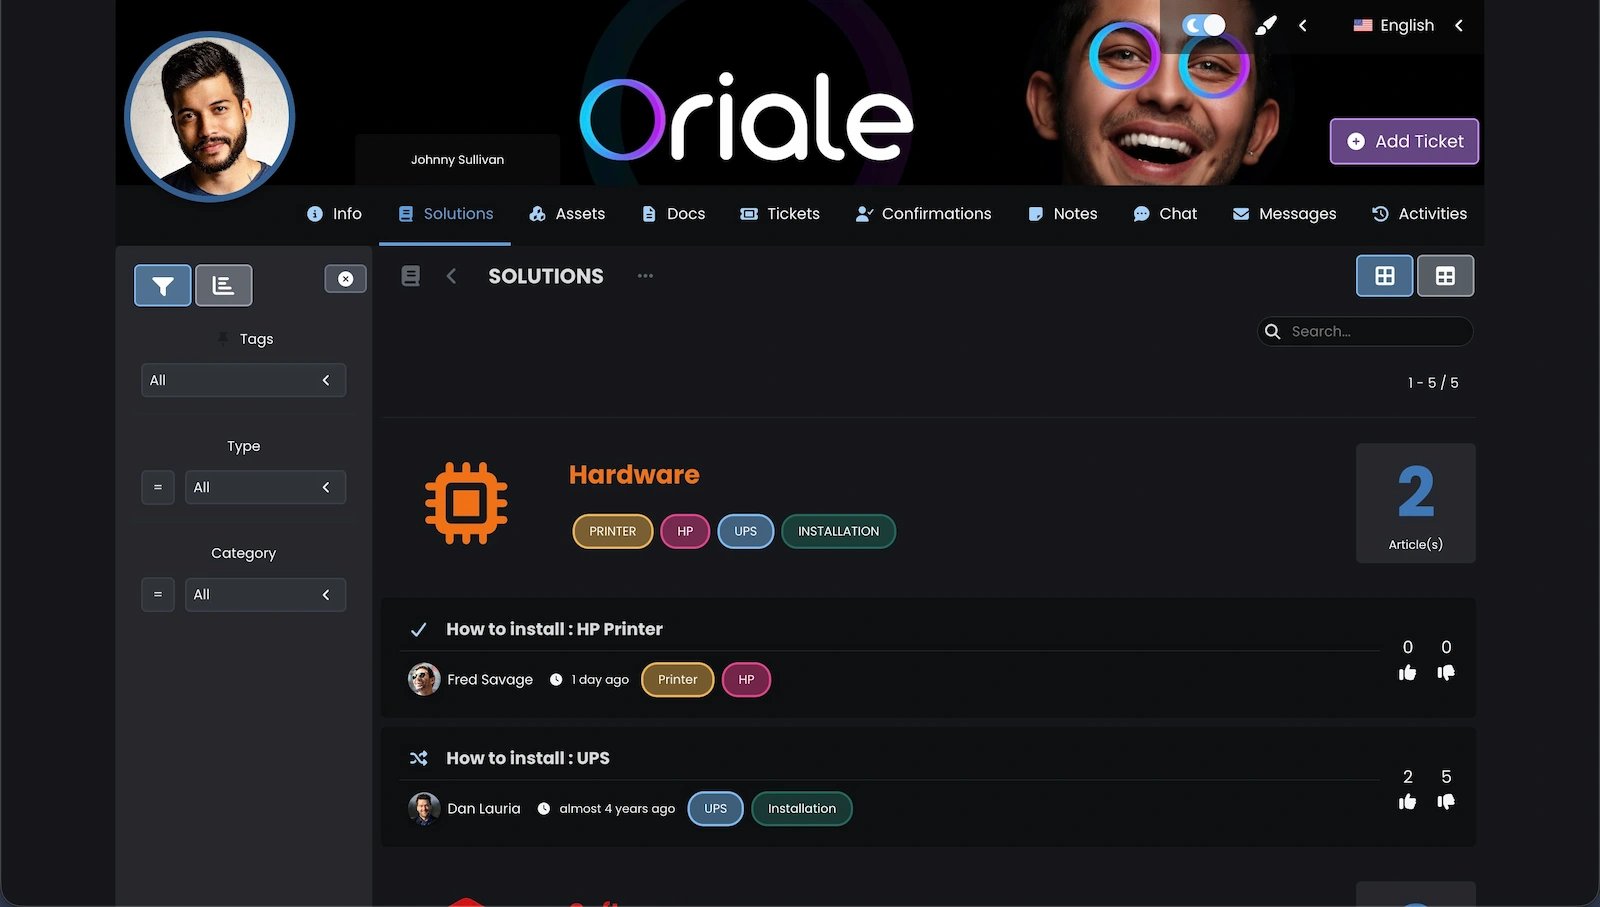
The portal article list lets users browse instructions by category and tag. Each material can show its author, date and helpfulness rating, helping the user choose the right content.
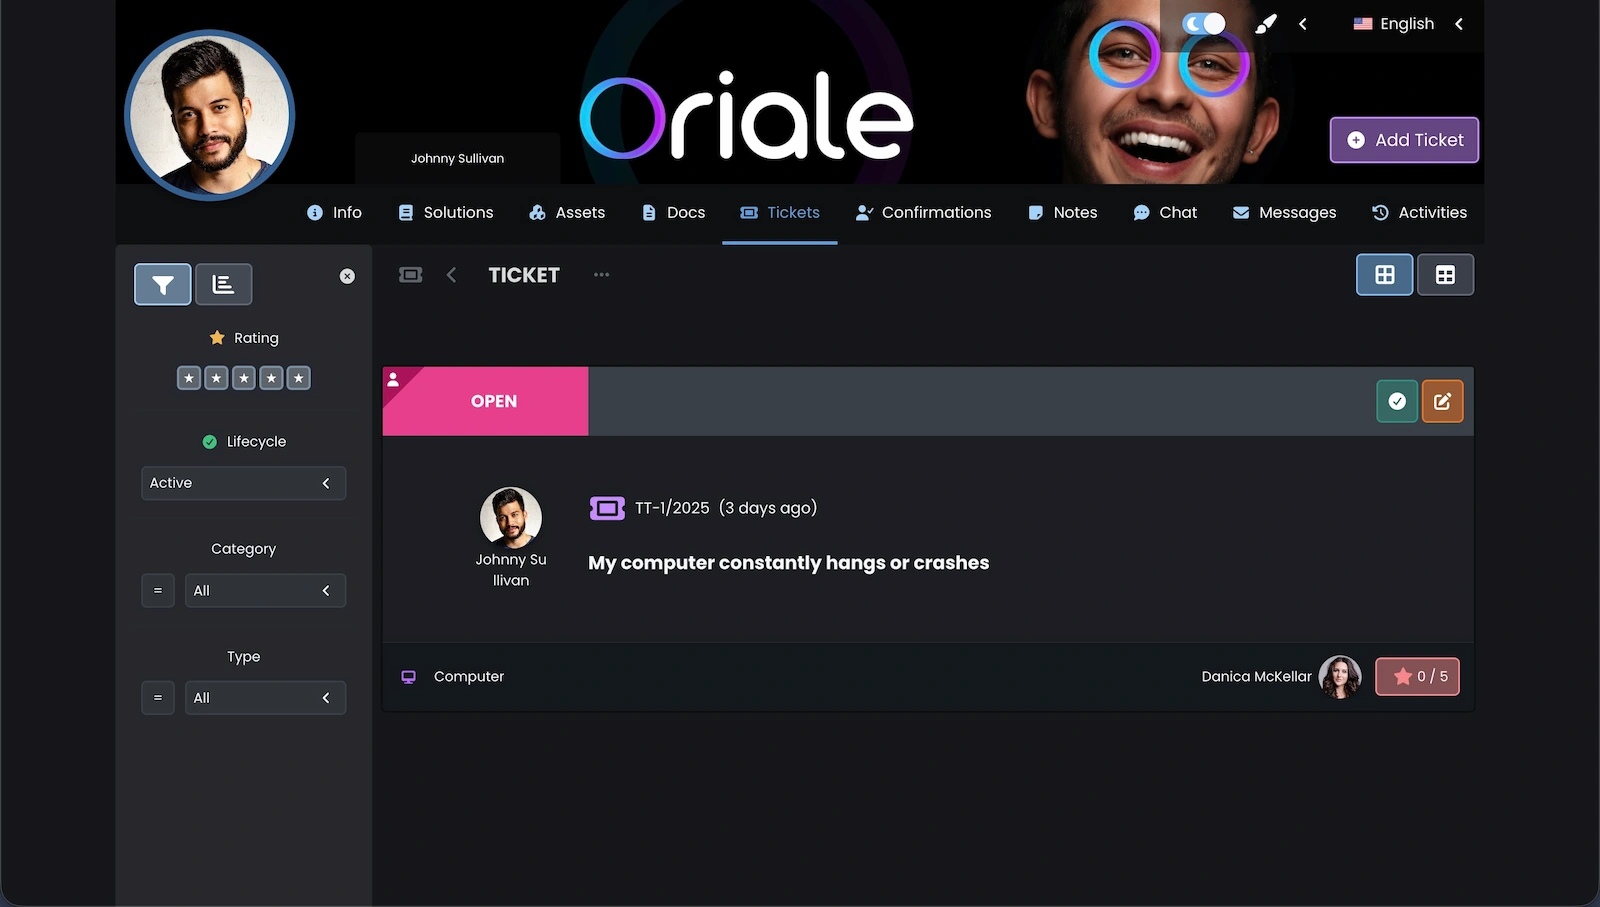
A ticket card shows its subject, requester, status, category and assigned agent. Users can check the most important information without entering the full administrative area of the system.
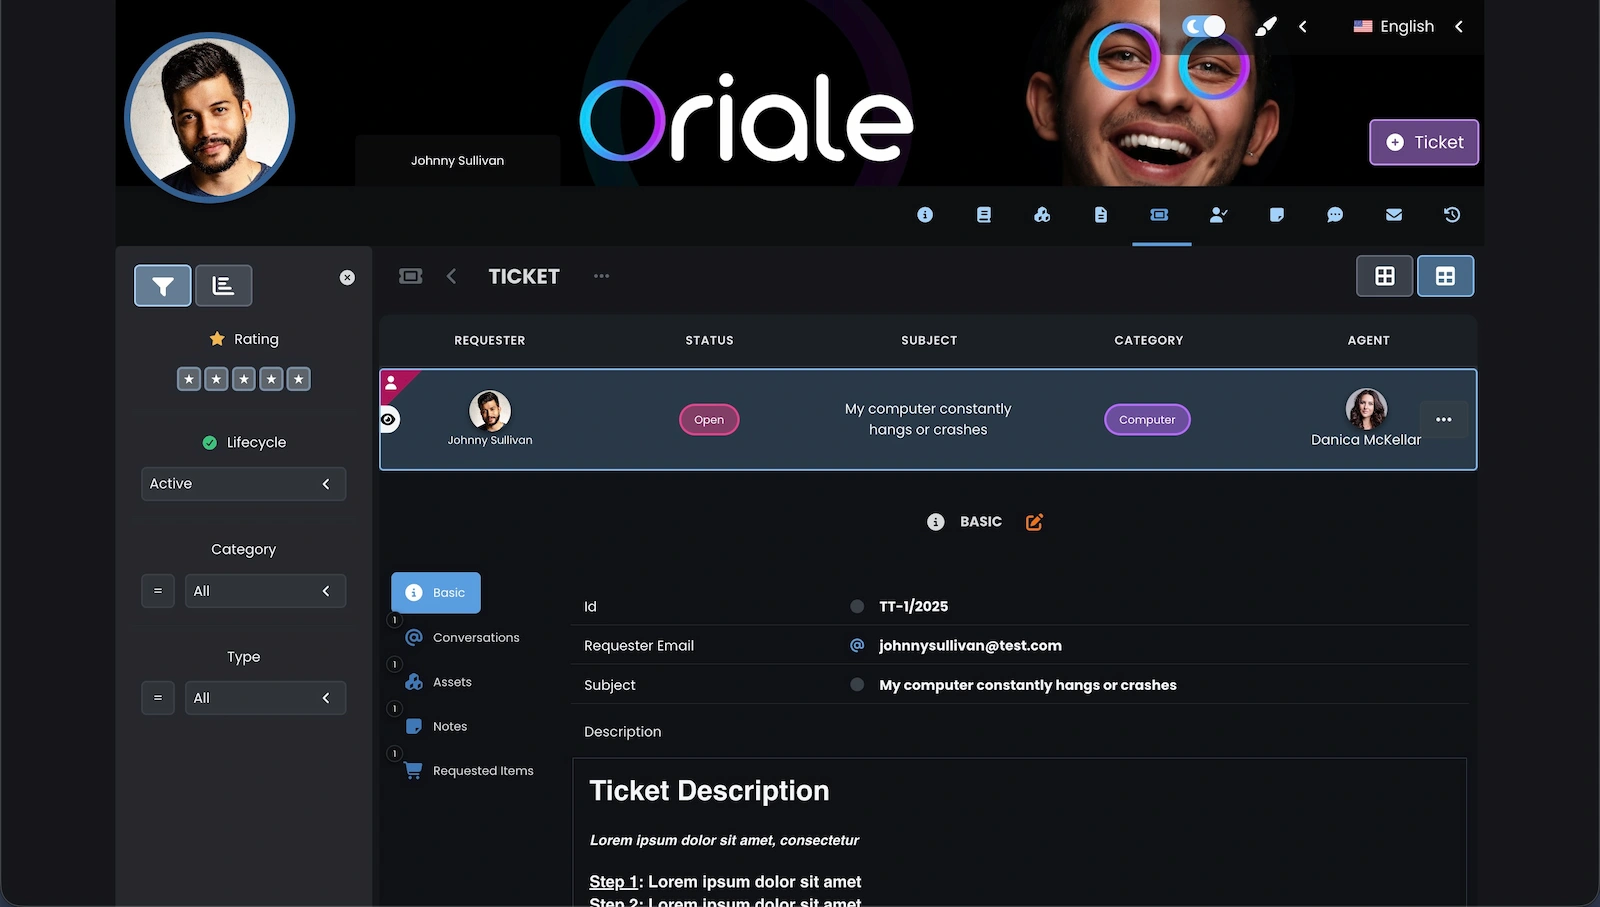
Ticket details contain the subject, description, requester information and assigned person. Additional sections lead to conversations, assets, notes and requests connected with the ticket.
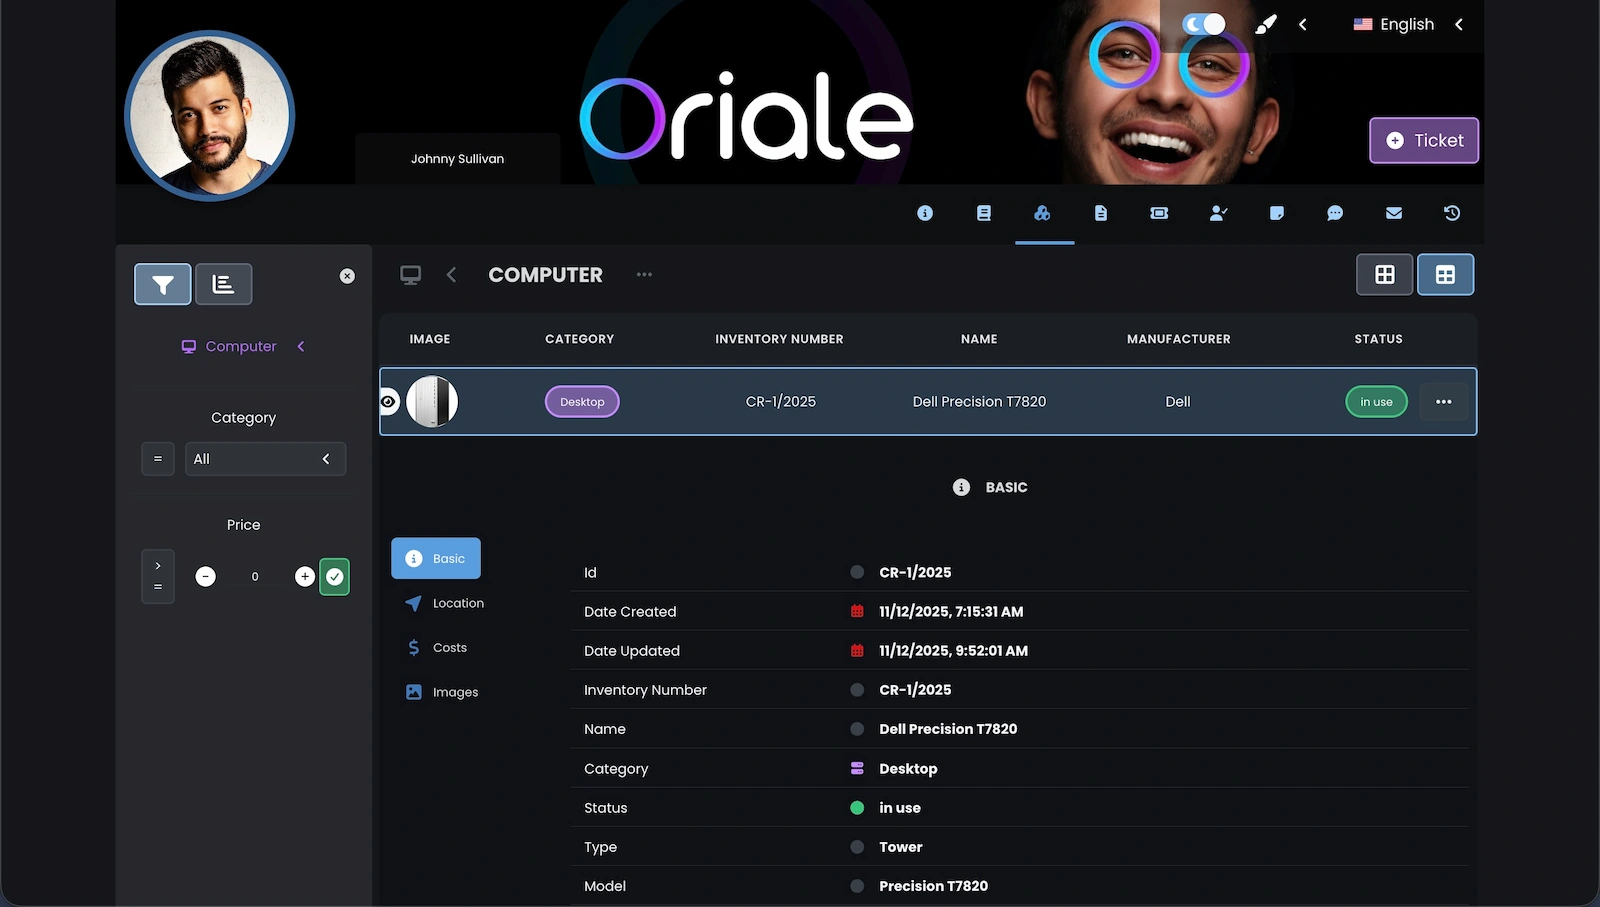
Users can see the computer assigned to their account together with basic inventory data, its name, manufacturer and status. The device details are available below the list.
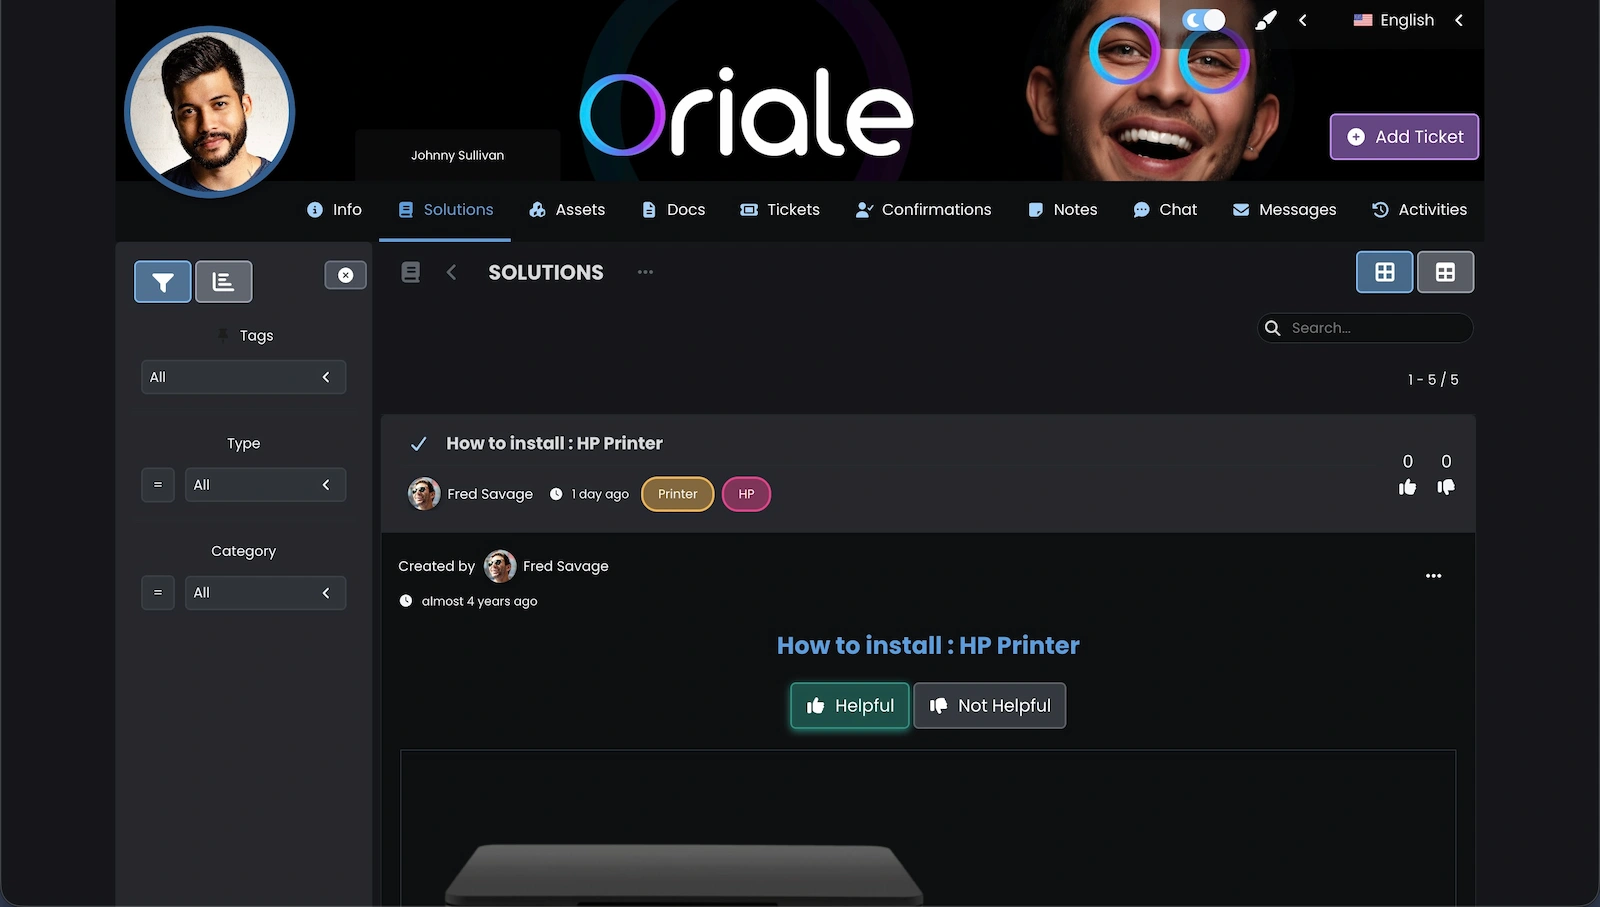
A knowledge base article contains instructions and an option to indicate whether the material was helpful. Users can use the explanation before creating a new ticket.
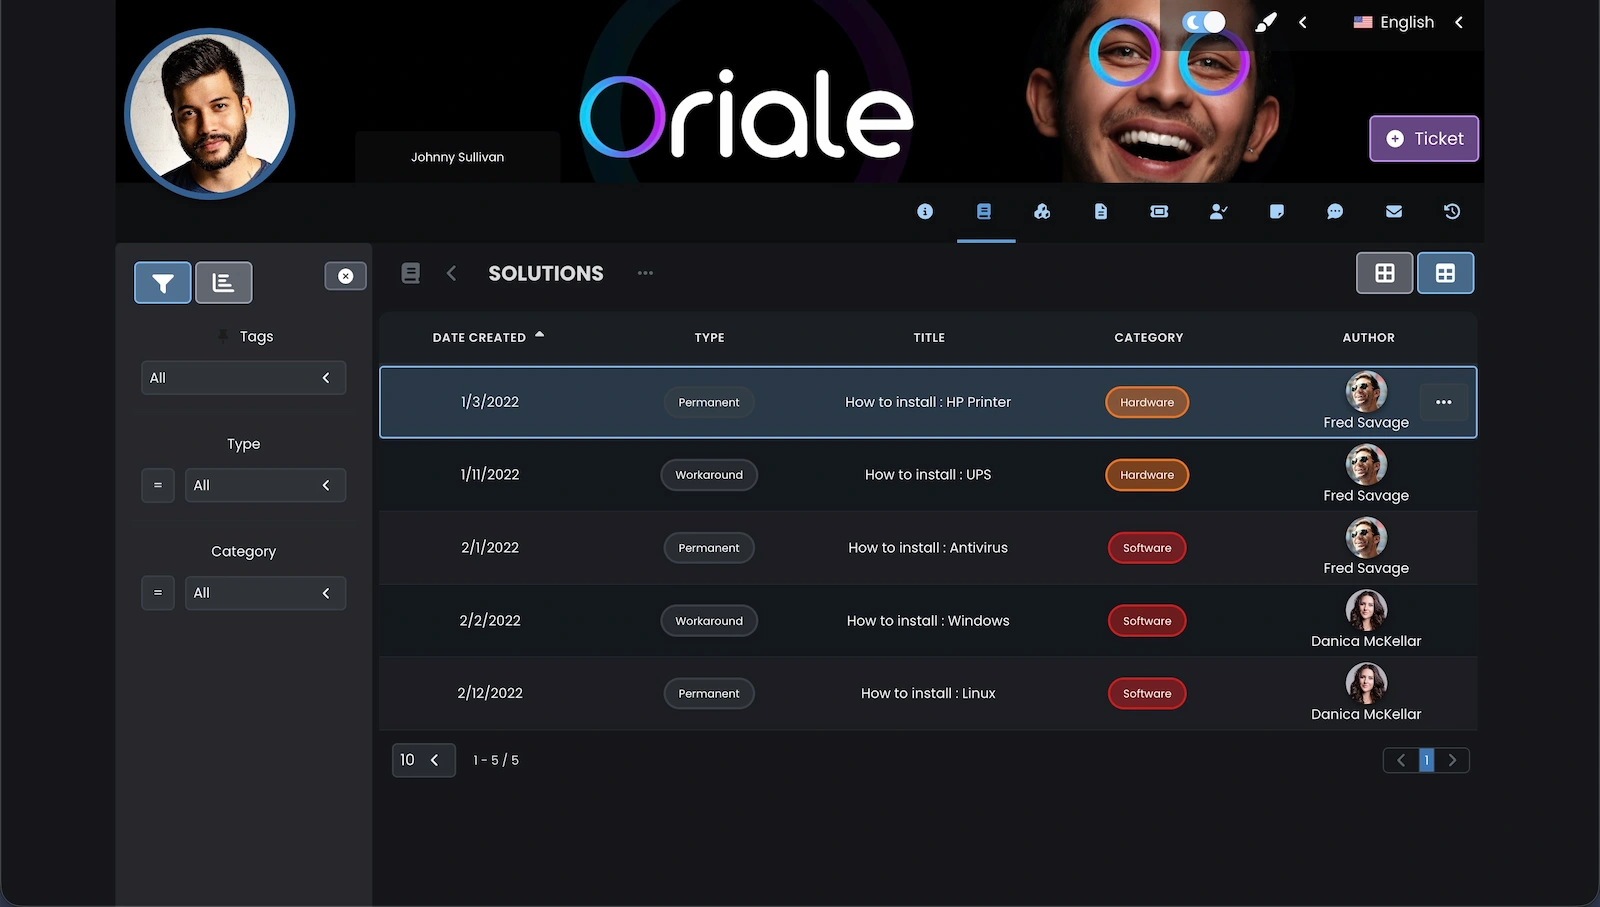
The table organizes articles by creation date, type, title, category and author. This makes it easier to find the right instruction and understand its purpose before opening it.
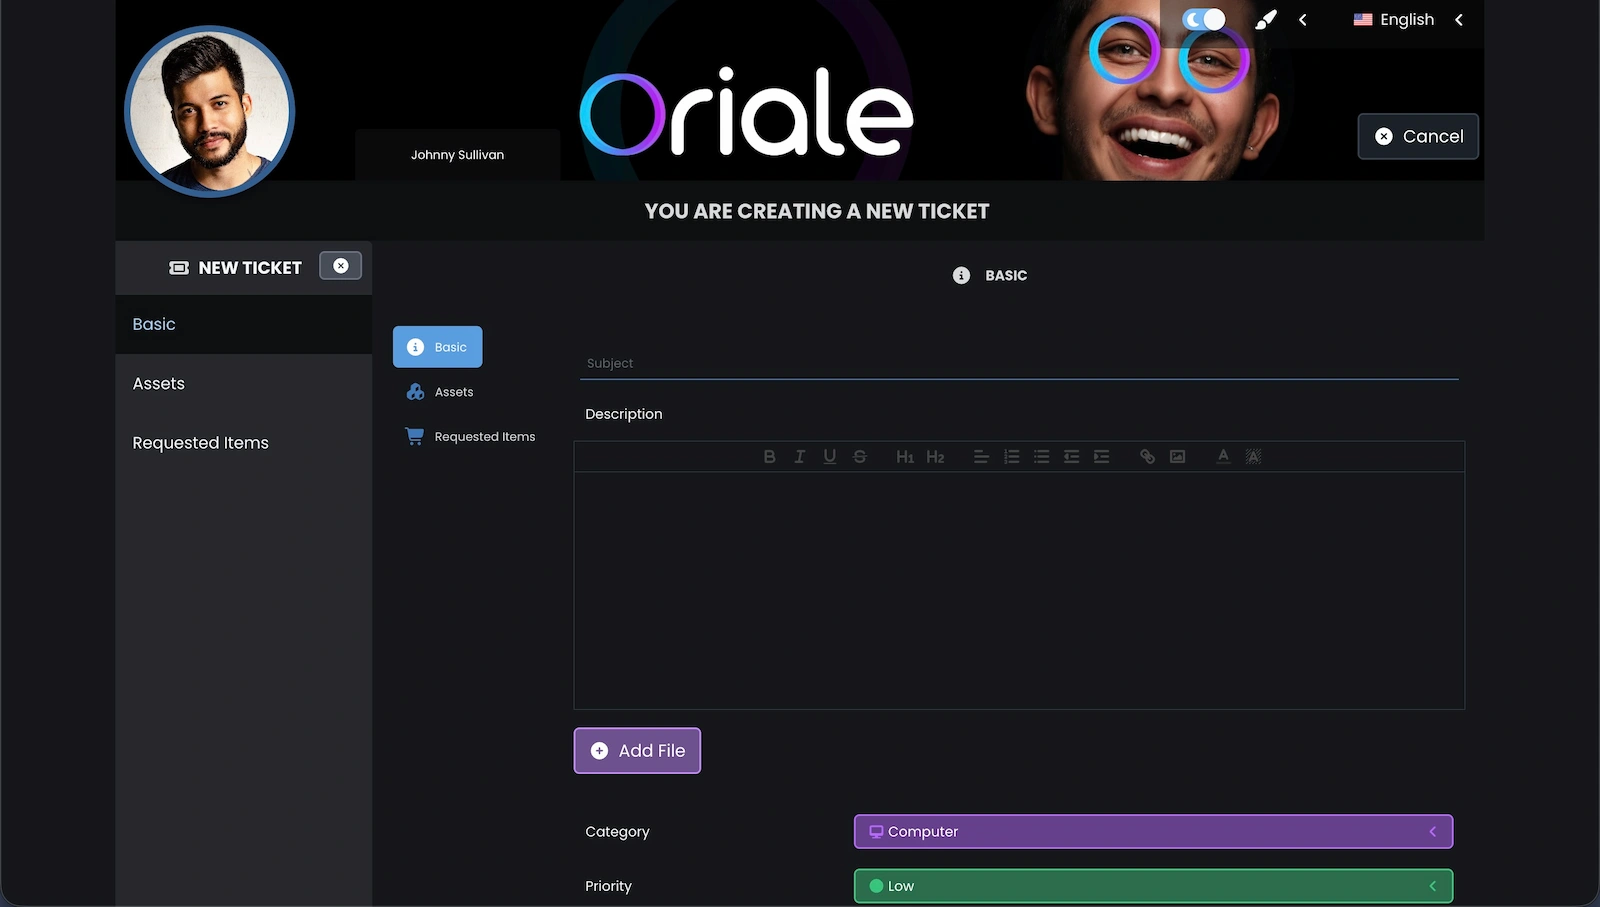
The ticket creation form lets users describe a problem, add a file, choose a category and set a priority. The ticket can also include assets or requests connected with it.
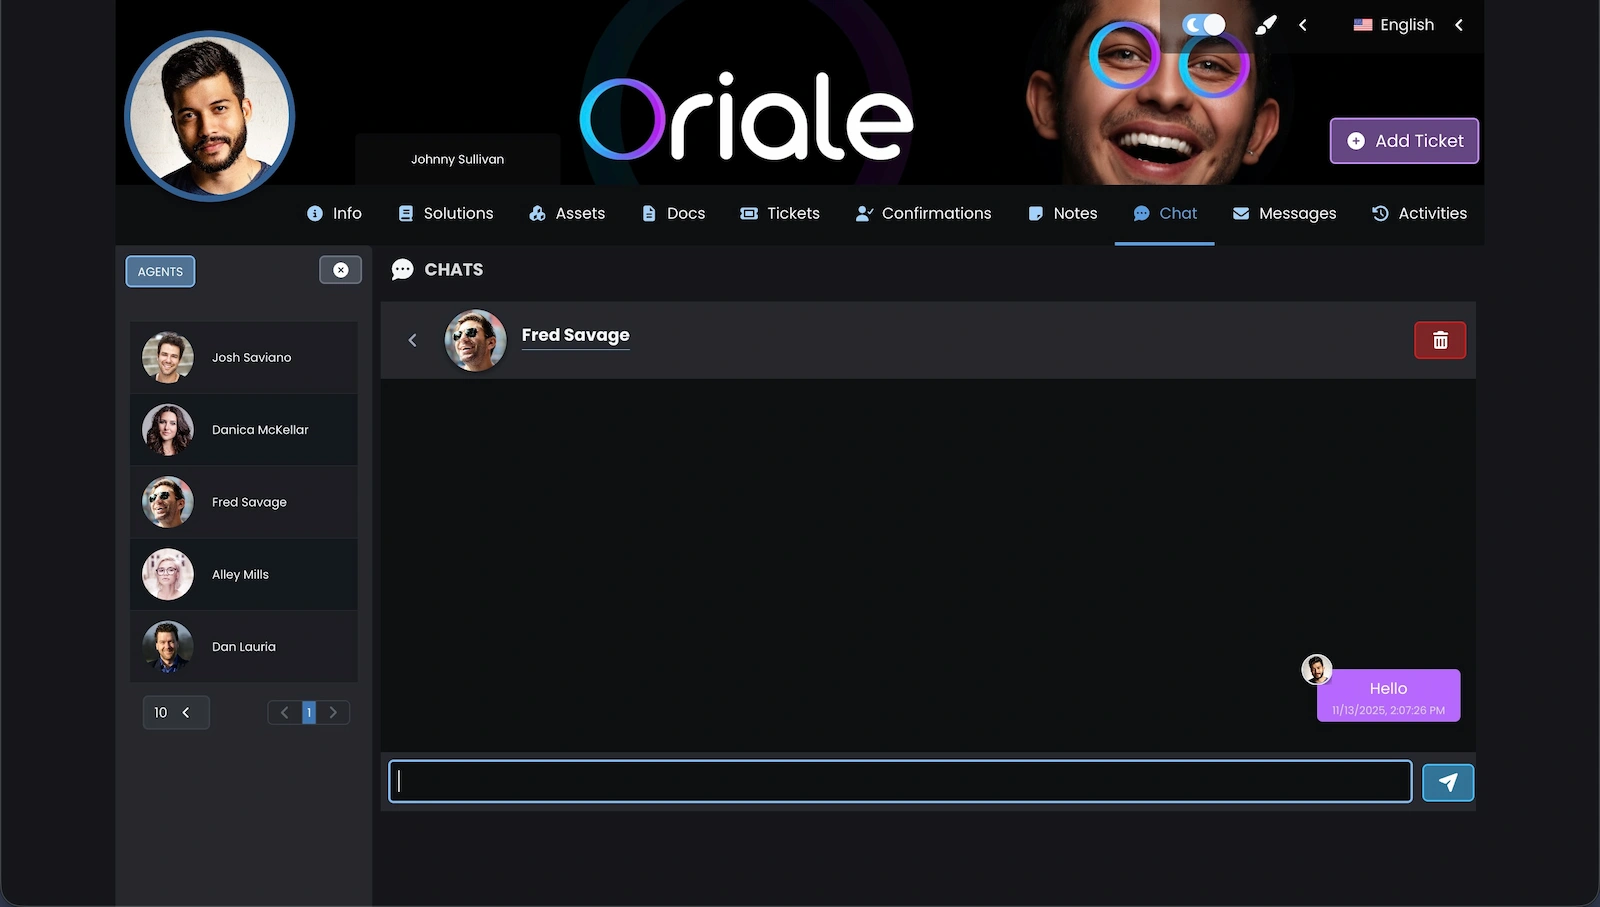
The chat shows available people and a conversation with the selected agent. Users can send a message without leaving the portal or opening a separate contact channel.
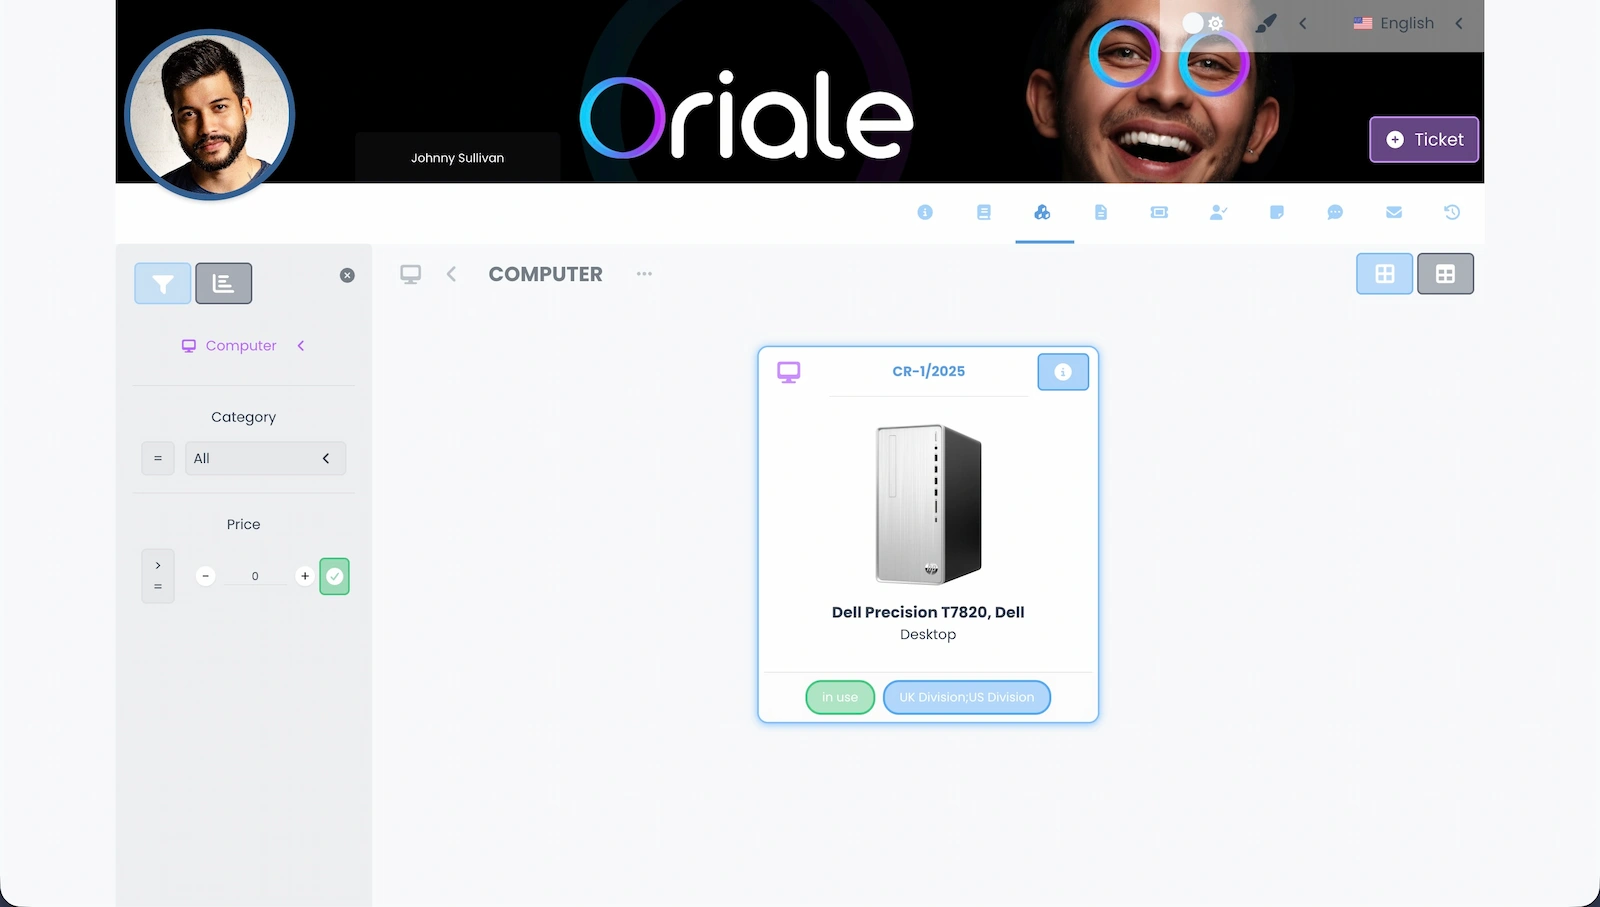
The card presents the assigned computer with its image, name, status and location. It provides a quick view of the user's own equipment from the portal.
Want to see how Codenica could work for your company?
Create a free company account and test selected features in practice.